Automated Data Plotter
This application dynamically generates many types of graphs derived from various IEM data sources. Feel free to use these generated graphics in whatever way you wish.
1 Select a Chart Type
2 Configure Chart Options
Plot Description:
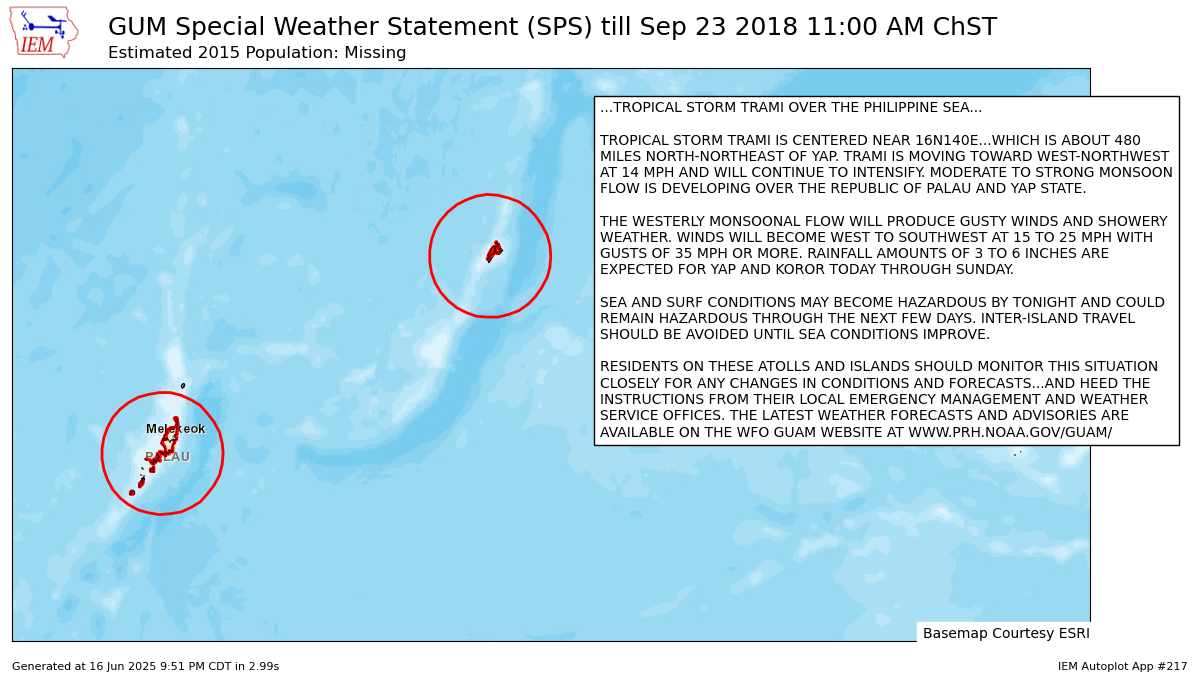
This plot is not meant for interactive use, but a backend for SPS plots. A more approachable frontend is to visit the NWS Text by WFO page and click on the SPS product you are interested in.3 Generated Chart
Based on recent timings, plot generation averages 4 seconds. Please wait while your chart is being generated...
If you notice plotting issues with the image above, please
contact us
and provide the URL address currently shown by your web browser.
IEM Daily Features using this plot
The IEM Daily Features found on this website often utilize plots found on this application. Here is a listing of features referencing this plot type.
- 07 Nov 2024: SPS Graphics
- 08 Dec 2022: Special Weather Statement