Automated Data Plotter
This application dynamically generates many types of graphs derived from various IEM data sources. Feel free to use these generated graphics in whatever way you wish.
1 Select a Chart Type
2 Configure Chart Options
Plot Description:
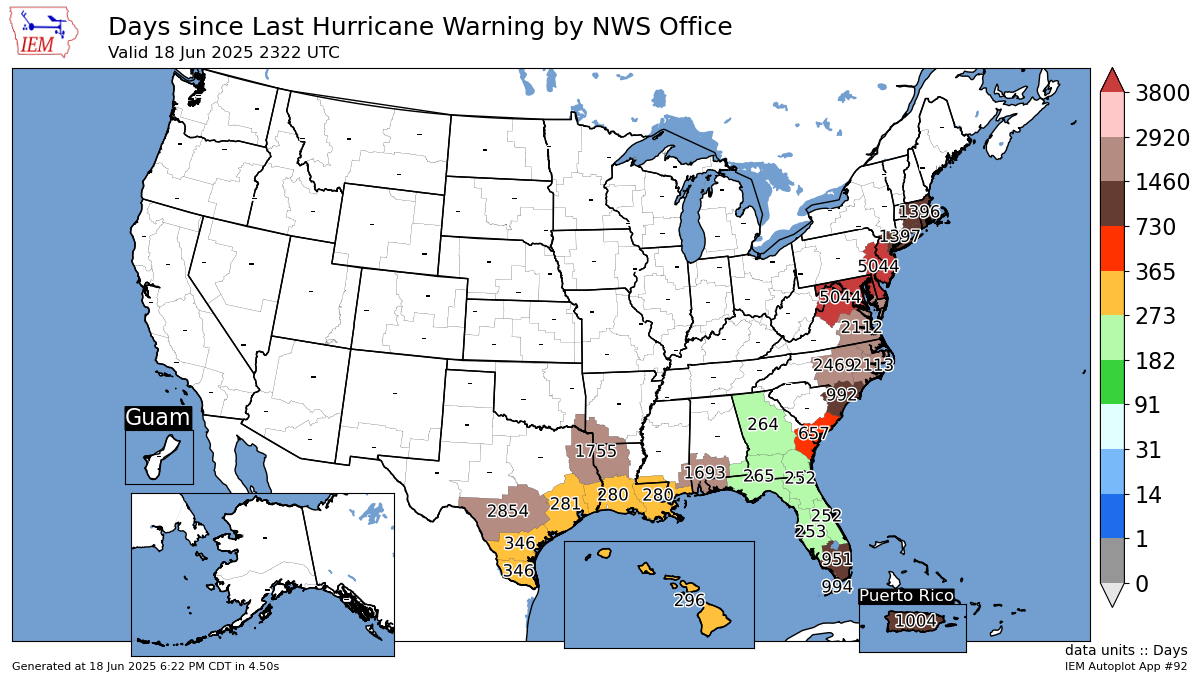
This map depicts the number of days since a Weather Forecast Office has issued a given VTEC product. You can set the plot to a retroactive date, which computes the number of number of days prior to that date.3 Generated Chart
Based on recent timings, plot generation averages 7 seconds. Please wait while your chart is being generated...
If you notice plotting issues with the image above, please
contact us
and provide the URL address currently shown by your web browser.
IEM Daily Features using this plot
The IEM Daily Features found on this website often utilize plots found on this application. Here is a listing of features referencing this plot type.
- 04 Dec 2024: Days since last Wind Advisory
- 18 Nov 2022: Days since last Blizzard Warning
- 02 Mar 2021: Days Since Last SVR Warning
- 12 Jul 2019: Last Hurricane Warning
- 11 Dec 2017: Days since last Winter Storm Warning
- 13 Jan 2017: Since Last Ice Storm Warning
- 07 Sep 2016: Since Last Flash Flood Watch
- 01 Apr 2015: Days since last Severe Warning
- 14 Oct 2014: Days since last Tornado Warning
- 10 May 2013: The Last Tornado Warning