IEM Daily Feature
Wednesday, 04 June 2025
Wednesday, 04 June 2025
Covering the State
Posted: 04 Jun 2025 05:30 AM
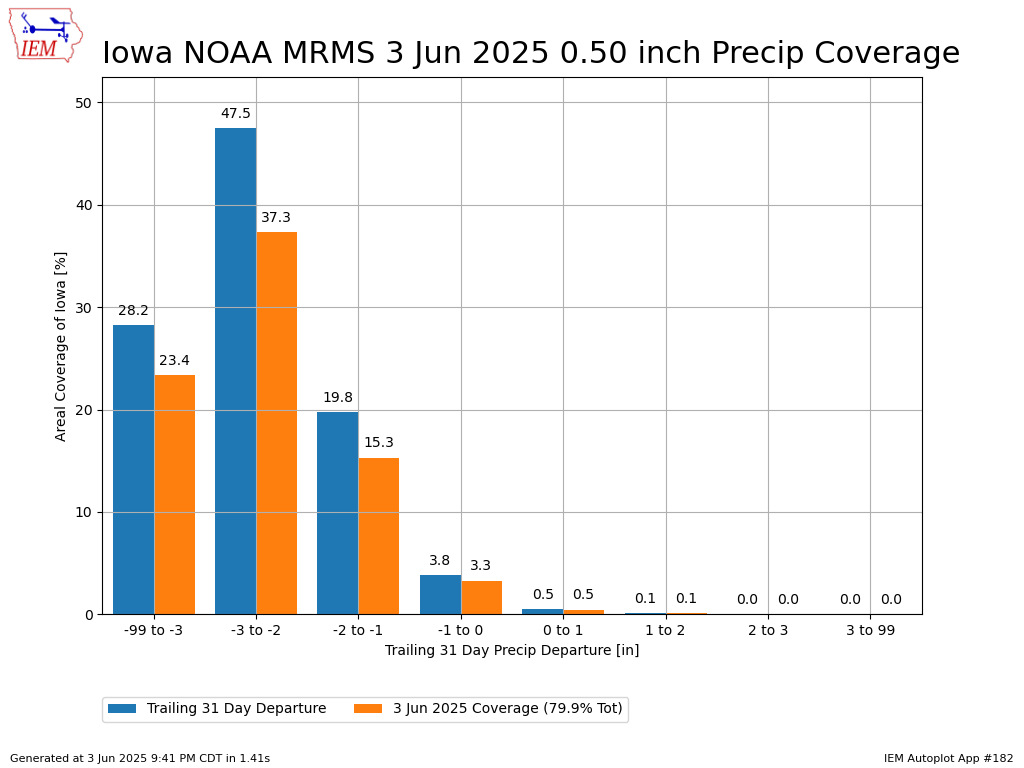
Outside of a few damaging thunderstorms impacting the far NW corner of the state Monday evening and the far SE corner on Tuesday, much needed rainfall blanketed the state. The featured chart attempts to quantify the efficiency of the Tuesday rainfall thanks to MRMS estimates. The chart contains two sets of bar charts. The blue bars represent the proportion of Iowa at a given precipitation departure over the past 31 days. The orange bars quantify the percentage of the total area on Tuesday that received at least a half inch of precipitation and fell over the given departure area. Of immediate notice is that practically the entire state was below average prior to Tuesday over the previous 31 days (basically May). The overall estimate is that 80% of the state got at least a half inch on Tuesday with a generally unbiased distribution of where that rain fell. Rewording, the driest areas of the state didn't necessarily miss out from this rainfall event.
Voting:
Good = 11
Bad = 1
Voting:
Good = 11
Bad = 1