IEM Daily Feature
Friday, 09 June 2023
Friday, 09 June 2023
Change in 60 Day SPI
Posted: 09 Jun 2023 05:30 AM
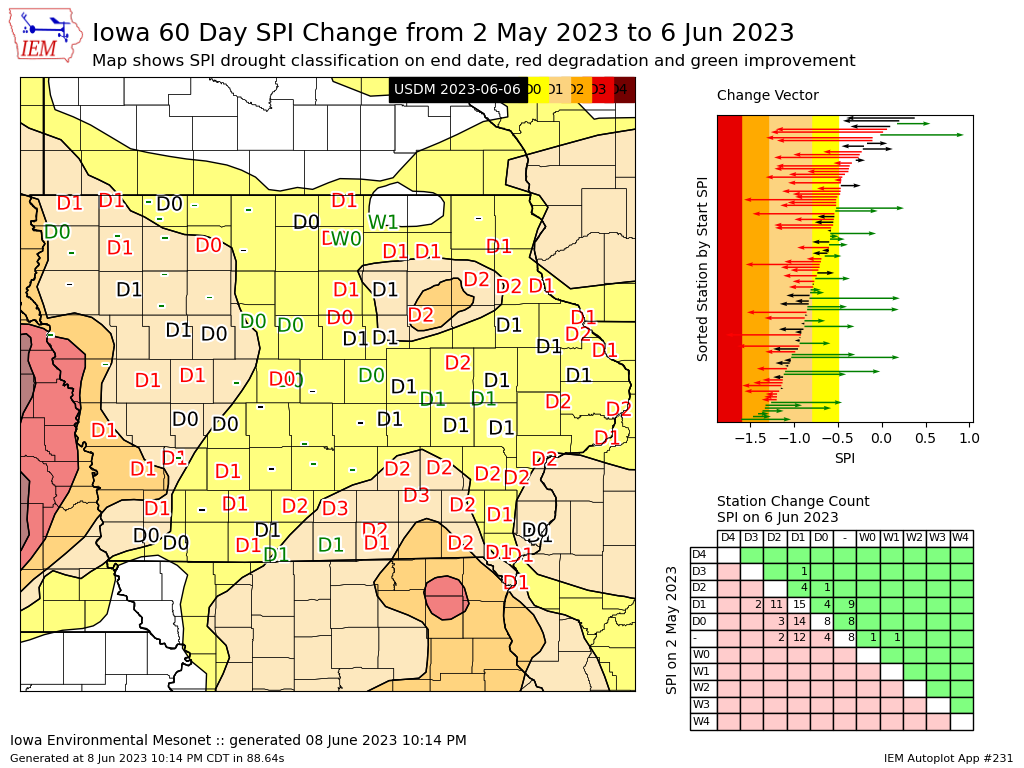
The weekly release of the US Drought Monitor yesterday degraded much of the state with only small
areas left analyzed without drought. The featured map and charts attempt to show how one metric that
goes into drought monitoring, the Standardized Precipitation Index (SPI), has changed over
approximately the last month. A trailing 60 day SPI is computed on 2 May and then compared with the
same metric computed on 6 June. The top right panel shows arrows indicating how each of the long
term climate sites in the state changed over this period. Colored arrows indicate at least a one category
change. The bottom right panel shows the station count changing between the various SPI based
drought categories. The map plots some of the current SPI based drought categories and is also
colored by if it changed over this period. The filled in area on the map is the most recent drought
monitor. So the main point here is found in the top right panel showing many of the points that started
off in no or D0 drought category have degraded one to two categories. Areas east of Waterloo and
southeastern Iowa have seem the worst of the degrading conditions since early May.
Voting:
Good = 11
Bad = 1
Voting:
Good = 11
Bad = 1