Summer Dew Point Trend
Posted:
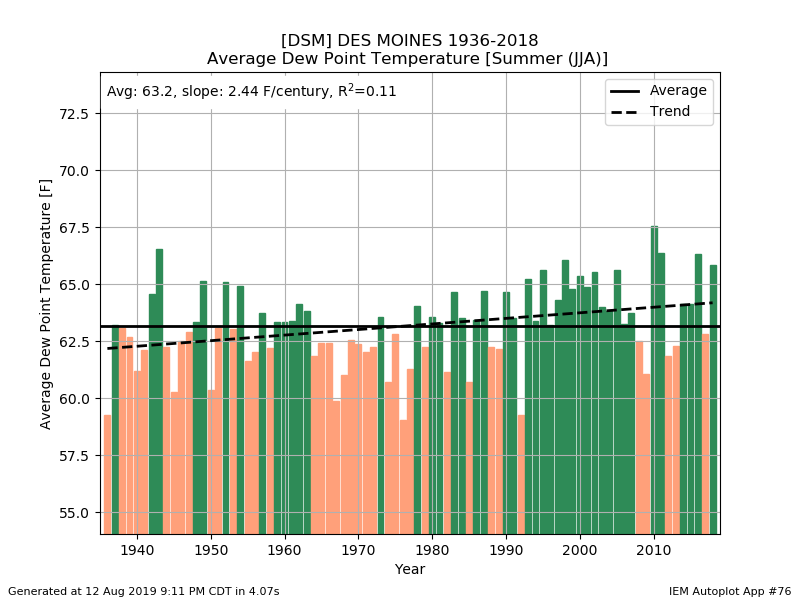
The featured chart presents an analysis of average summer (Jun, Jul, Aug) dew point for Des Moines
based on available hourly observations. A simple linear regression fit is shown for the dataset and
indicates an upward trend. The color of the bars indicate if the given year is above or below the
simple long term average. A majority of the recent 30 years are shown to be above average.
Preliminary data for this year (not shown) has this summer coming in slightly above average as well.
The near term forecast has a drop in humidity for mid-week.
Voting:
Good = 15
Bad = 0
Tags: dewpoint summer
Tags: dewpoint summer
Voting:
Good = 15
Bad = 0
Tags: dewpoint summer
Tags: dewpoint summer