September Slide
Posted:
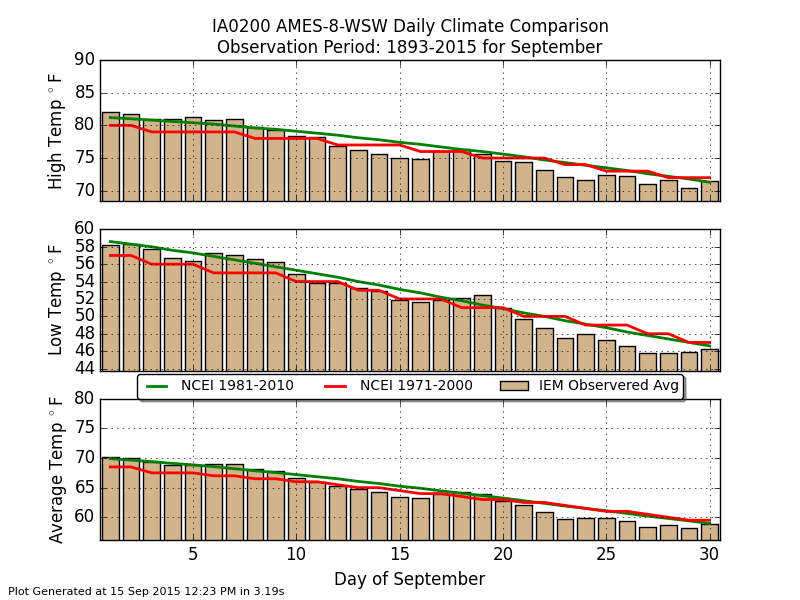
The featured chart displays three daily climatology datasets. Every ten years, the National
Center for Environmental Information (formerly NCDC) produces a 30 year climatology.
Those values for 1971-2000 and 1981-2010 are shown on the chart along with the raw
daily averages based on the period of record computed by the IEM. On an individual day
there are differences in these three datasets, so which one is right? The answer is they all
are! The NCEI climatologies are smoothed to remove day to day variability that results
from a 30 year sample size.
Voting:
Good = 15
Bad = 11
Abstain = 5
Tags: climate
Tags: climate
Voting:
Good = 15
Bad = 11
Abstain = 5
Tags: climate
Tags: climate