Cycling Around
Posted:
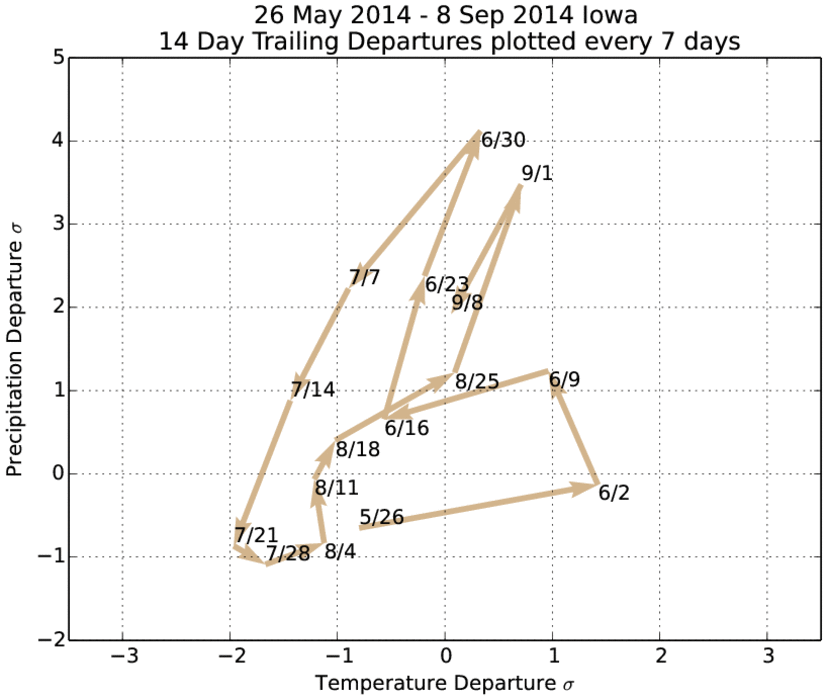
The featured chart displays a time series of temperature and precipitation departures for
Iowa statewide averaged values since late May. For every seven days, the lagging 14
days departure is plotted. Charts like this tend to cycle around as we move between wet /
dry and cold / hot periods. It is interesting how we have seen two distinct wet periods.
Will we cycle back down to dry and cold or go somewhere else?
Voting:
Good = 11
Bad = 7
Abstain = 6
Voting:
Good = 11
Bad = 7
Abstain = 6