Daily Precipitation
Posted:
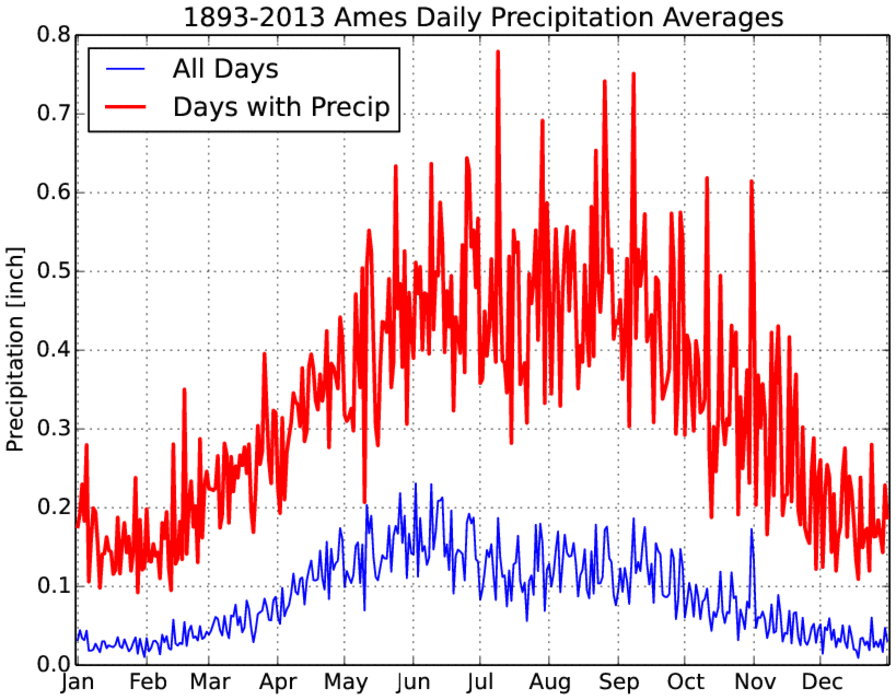
The featured chart presents the daily climatology of precipitation for Ames using period of
record data. The blue line represents the simple daily average of precipitation using all
days and the red line is the simple average over only the days on which precipitation was
reported. These two lines answer the question what is the average daily precipitation and
what is the average daily precipitation when it actually precipitates that day. While the blue
line peaks in early June, the red line plateaus through the summer. The nature of the
summer time thunderstorms is rather consistent over the summer months, but their
frequency decreases as the summer passes. So the blue line peaks during the peak in
thunderstorm activity, while the red line decreases once we are out of summer and into
September.
Voting:
Good = 11
Bad = 4
Tags: climate precip
Tags: climate precip
Voting:
Good = 11
Bad = 4
Tags: climate precip
Tags: climate precip