Daylight Duration and Change
Posted:
While the days recently have been noticeably cold, they have almost been noticeably
getting longer! Daylight time increase after the winter solstice (21 Dec) until the summer
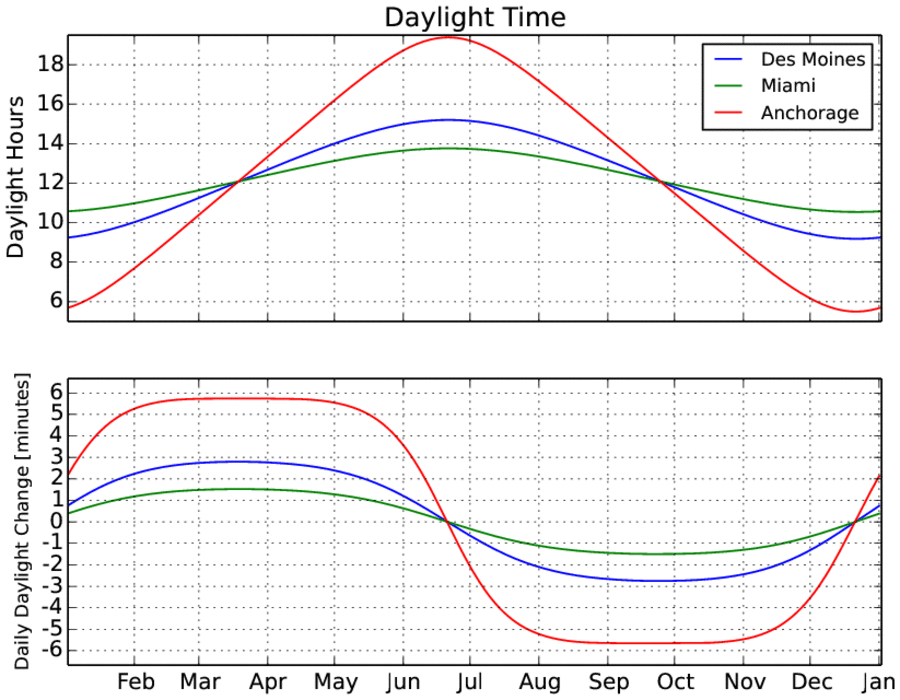
solstice on 21 June. The top panel in the featured chart presents the daylight time by day
of year and the bottom chart presents the day to day change in daylight time. Three
locations are shown to illustrate the difference with latitude. For daylight duration, the three
lines intersect on the vernal and autumnal equinox as all locations on earth are at
approximately 12 hours of daylight. For the daily change plot, the three lines intersect at
the solstice as the rate changes sign for all locations on earth. It is kind of interesting to
note how the daily change curve flattens out for Anchorage. The hand-waving explanation
is that this is due to the trigonometry involved with the cosine function rate of change
flattening.
Voting:
Good = 83
Bad = 11
Abstain = 9
Tags: solar
Voting:
Good = 83
Bad = 11
Abstain = 9
Tags: solar