June max temp and rainfall
Posted:
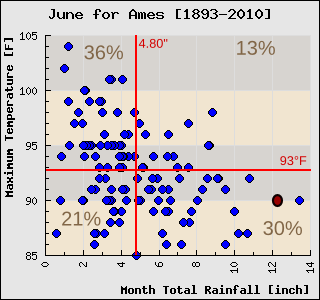
The featured chart plots the relationship between the total rainfall
during June with maximum temperature observed based on data from Ames.
The red lines indicate the average value and the percentages show the
frequency of the observations in each quadrant. Having both above
average rainfall and maximum temperature is the least common
combination, which makes physical sense as typically the warmest
temperatures are associated with dry soils, which implies less
precipitation. The 2010 value is shown with the red dot.
Voting:
Good = 23
Bad = 3
Tags: june
Tags: june
Voting:
Good = 23
Bad = 3
Tags: june
Tags: june