Nice curves
Posted:

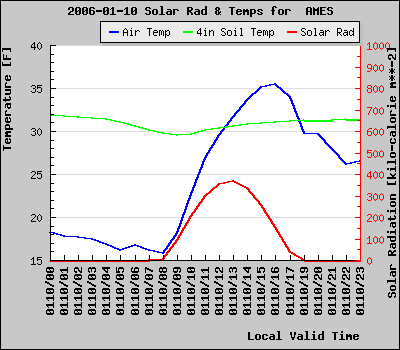
The featured image charts hourly solar radiation, air temperature, and 4 inch soil temperature. A mostly sunny day can make for a really interesting plot. You can see how air temperatures peak at their highest value a few hours before the soil temperatures do. You can also see the symmetric curve of solar radiation as the sun transverses the sky. Based on this plot, can you guess if there is snow on the ground at the site?
Voting:
Good = 9
Bad = 1
Voting:
Good = 9
Bad = 1