Past Features
This page lists out the IEM Daily Features for a month at a time. Features have been posted on most days since February 2002. List all feature titles.
Wed Nov 01, 2017

October Range
01 Nov 2017 06:16 AM
October is in the books now and experienced both warm and very cold days. The overall range in temperature for Ames was 59 degrees between a low of 21 and high of 80. This range is just about normal for the month as shown by the featured chart. The chart shows the range between the coldest low and warmest high for the month. The bottom panel shows range between these two values.
Voting: Good - 5 Bad - 3
Generate This Chart on Website
Thu Nov 02, 2017

Very Wet October
02 Nov 2017 05:34 AM
The featured map depicts IEM estimates of October 2017 ranks for total precipitation. A value of one would signify the wettest October since 1893. Most of Iowa is shown in the top five with northern Iowa all at second wettest. All of this rain has put a damper on fall crop harvest progress and water logged fields create challenges to transverse heavy harvest equipment over.
Voting: Good - 10 Bad - 0
Tags: oct17
Generate This Chart on Website
Fri Nov 03, 2017

Recent Drops to Average
03 Nov 2017 05:35 AM
Our recent stretch of very cold weather finally put an end to the frost free growing season for the state. The featured chart displays some statistics on the season to date coldest low temperature for Ames. The time series for this year is shown by the blue line with the black line representing the long term average. Our recent drops have put this year near average for the to date period. The pink area represents the range between the minimum and maximum with this year very close to the top during early October. Of course, the cold weather is only getting started for the season and the chart shows the amount of room to the downside yet to go before the end of the year!
Voting: Good - 5 Bad - 0
Generate This Chart on Website
Mon Nov 06, 2017

Larger Drops Still to Come
06 Nov 2017 05:31 AM
Friday's IEM Daily Feature showed the season to date minimum temperatures so far. Today's featured chart shows the largest daily drop by year for that metric. Rewording, what was the largest temperature drop for setting a new season to date minimum temperature. This year's value is a mere six degrees and the chart would suggest that having a larger temperature drop yet this season would be likely. The forecast does not hint as to when that may happen though as it will likely take our first snowfall cover event to get much colder low temperatures.
Voting: Good - 8 Bad - 0
Generate This Chart on Website
Tue Nov 07, 2017

Nearing Two Weeks Below
07 Nov 2017 05:35 AM
Our seasonally chilly weather continued on Monday with highs well below average again. The featured map displays the number of consecutive days that the high temperature has been above (red) or below (blue) average for NWS "CLI" reporting sites. The totals for Iowa are approaching two weeks now with more chilly weather in the forecast. There is some hope for a return to near normal highs next week.
Voting: Good - 9 Bad - 0
Tags: nov17
Generate This Chart on Website
Wed Nov 08, 2017

Wisconsin is most behind
08 Nov 2017 05:36 AM
The most recent USDA NASS statistics showing corn crop harvest progress was released on Monday. The featured map displays the statewide estimates for corn harvest along with the departure from a simple past 10 year average for the date. Iowa is shown behind average along with almost all other states, but the largest departure is indicated for Wisconsin, which has seen plenty of wet weather this harvest season.
Voting: Good - 11 Bad - 0
Thu Nov 09, 2017

Snow Makes Big Difference
09 Nov 2017 05:34 AM
The featured chart displays the average high and low temperature by month for Des Moines partitioned by the presence of snow cover. Placing aside some timing aspects of how the snow depth is reported along with max and min temperatures, the chart shows a clear difference in averages between snow and non-snow covered condition. The presence of snow changes the game for how heat is lost during the night time and what happens to the inbound heating by the sun during the day. Having said all this and even without the presence of snow, today's temperatures will be remarkably cold.
Voting: Good - 7 Bad - 0
Generate This Chart on Website
Fri Nov 10, 2017

Cold Early November Day
10 Nov 2017 05:32 AM
Yesterday's feature denoted the impact of having snow cover on high and low temperatures. Even without snow cover in Iowa, temperatures were very cold for this time of the year. The featured table presents the hourly temperatures for Des Moines yesterday and how far back into the archives one must go to find as cold an hourly temperature for the period of 1-9 November. The afternoon temperatures were the coldest in about 10 years and evening temperatures the coldest in over 20 years! It will be interesting to put into context the very cold lows observed this Friday morning for a future feature!
Voting: Good - 3 Bad - 1
Tags: nov17
Mon Nov 13, 2017

Days with Low Below Freezing
13 Nov 2017 05:34 AM
While temperatures did warm some over the weekend, daily lows for most of the days this November have been below freezing. The featured chart displays the year to date accumulated total of days with a low temperature below freezing for Des Moines. The 2017 total was sitting very close to the minimum on record, but the recent cold weather has lifted the total well away from the minimum plotted. More seasonable weather is expected this week with freezing temperatures only expected for a few of the days for Des Moines.
Voting: Good - 4 Bad - 0
Generate This Chart on Website
Tue Nov 14, 2017

Days with Fog Reported
14 Nov 2017 05:33 AM
Dense Fog was common over Iowa on Monday. The featured chart presents the number of days each month that at least one hourly report of Fog was made for the Des Moines Airport. This is based on the archive of hourly METAR reports from the site. Of course, not all days that report Fog are dense enough to warrant advisories, like those issued on Monday. The blue bars are the simply monthly average for period of record and red are so far this year. For the year, this chart would indicate the number of days with fog reported to be below average.
Voting: Good - 9 Bad - 1
Tags: metar
Generate This Chart on Website
Wed Nov 15, 2017

November Cloudiness
15 Nov 2017 05:36 AM
Sunshine has been at a premium so far this November. The featured chart displays the frequency of having the noon weather observation reporting "overcast" conditions by month (top chart) and by year for each November (bottom chart). The cloudiness we have seen so far this November has been the worst month so far this year and one of the cloudiest Novembers since 1951 (so far). Of course, there are more days to go this November, so hopefully we can have more sunny days like today.
Voting: Good - 10 Bad - 0
Generate This Chart on Website
Thu Nov 16, 2017

2017 First Fall Sub-32
16 Nov 2017 05:33 AM
The featured chart presents a crude analysis of the first fall sub 32 temperature for climate sites in the state tracked by the IEM. By the end of October, all locations in the state had seen sub 32 degrees. These dates were a bit later than average and needed as the agricultural crops were late maturing this year after some late planting dates and cool end to the growing season. You can generate this map for previous years and thresholds of your choice.
Voting: Good - 7 Bad - 1
Generate This Chart on Website
Fri Nov 17, 2017

Fayette Year to Date Precipitation
17 Nov 2017 05:36 AM
The wettest area of the state so far this year has been extreme northeastern Iowa. The featured chart highlights the year to date precipitation for Fayette. Back in mid July, the total was very close to the wettest to date on record for the site. A very dry August put 2017 much further behind the record pace, but a very wet October made up some ground. Getting 7.5 inches over the last 45 days of the year seems extremely unlikely, but there is always a chance!
Voting: Good - 12 Bad - 1
Generate This Chart on Website
Mon Nov 20, 2017
Been cold since first freeze
20 Nov 2017 05:34 AM
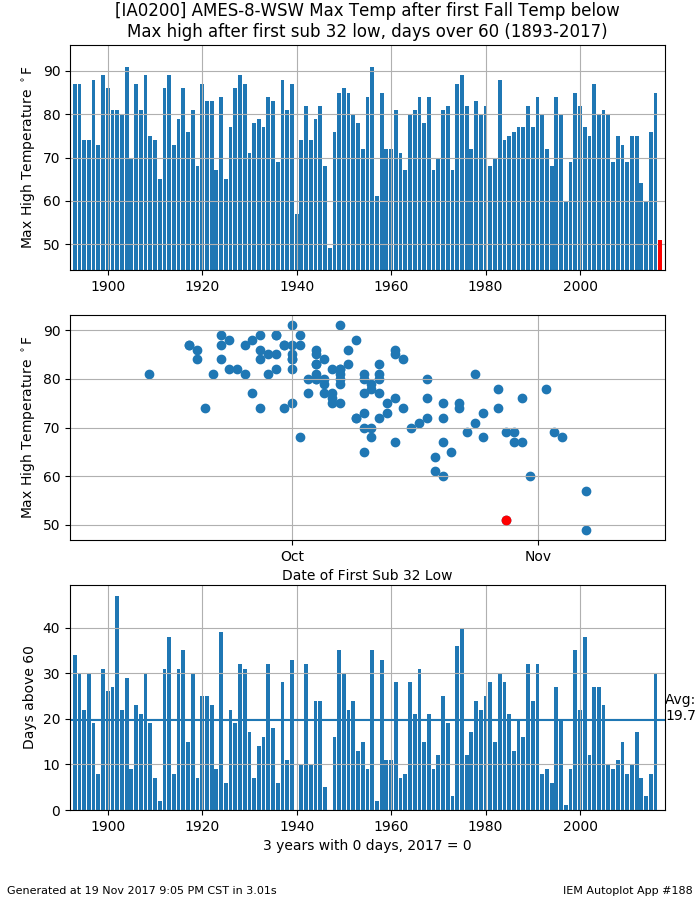
Since the first freeze of the season finally happened for places like Ames in late October, the temperatures have been rather chilly since. The featured chart looks at what we would expect to see after the first fall sub 32 degree temperature. The top panel shows the maximum high temperature following said date. The middle panel shows the combination of first fall sub 32 date and the subsequent max high. The bottom panel shows the number of 60+ degree high temperature days following said date each year. This year's max high is near the lowest on record and we have seen zero days 60+ so far. There are a few warm days in the forecast for this week, so we'll likely see the warmest temperatures since the freeze and maybe even a high above 60 degrees.
Voting: Good - 5 Bad - 0
Generate This Chart on Website
20 Nov 2017 05:34 AM
Since the first freeze of the season finally happened for places like Ames in late October, the temperatures have been rather chilly since. The featured chart looks at what we would expect to see after the first fall sub 32 degree temperature. The top panel shows the maximum high temperature following said date. The middle panel shows the combination of first fall sub 32 date and the subsequent max high. The bottom panel shows the number of 60+ degree high temperature days following said date each year. This year's max high is near the lowest on record and we have seen zero days 60+ so far. There are a few warm days in the forecast for this week, so we'll likely see the warmest temperatures since the freeze and maybe even a high above 60 degrees.
Voting: Good - 5 Bad - 0
Generate This Chart on Website
Tue Nov 21, 2017

60+ in November
21 Nov 2017 05:33 AM
It took until the 20th day of November to breach 60 degrees for places like Des Moines. Strong south/southwesterly winds helped to push temperatures finally well above normal. The featured chart is a wind rose and looks at wind speeds and directions during November when the air temperature is at or above 60 degrees for Des Moines. The wind rose is a wonderful way to see direction and speed frequencies. The longest bars coincide with what we experienced yesterday, which were winds from the SSW. Of course, not many occurrences of NW winds are shown as that is typically a source of cold air.
Voting: Good - 5 Bad - 0
Tags: nov
Generate This Chart on Website
Wed Nov 22, 2017

November Flight Categories
22 Nov 2017 05:34 AM
The primary purpose of the airport weather sensors is to help the aviation industry. The stations provide information that guides what type of aviation can take place. The featured chart shows four main flight categories from the Des Moines airport for this month. VFR (Visual Flight Rules, ceilings above 3k ft and visibility more than five miles) conditions have dominated this month. These conditions look to continue for the rest of this week, making for good Thanksgiving travel for those taking to the skies.
Voting: Good - 7 Bad - 0
Generate This Chart on Website
Thu Nov 23, 2017
Drab Thanksgiving
23 Nov 2017 05:22 AM
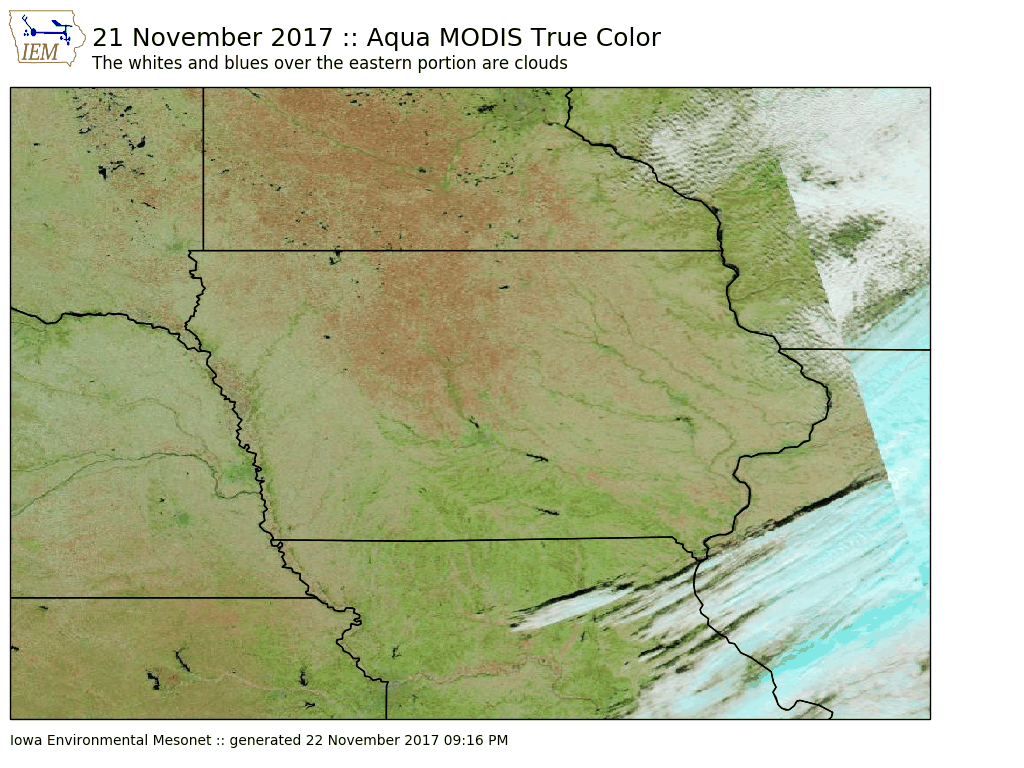
Skies on Tuesday were mostly clear over Iowa, so it is a good time to check in on how we look from space. The featured map is of Aqua MODIS true color imagery and the colors over the state are rather drab. The map is rather interesting though as it shows the various land forms over the state, with forested river valleys and the dominant / intensive agricultural land use over northcentral Iowa. The darker brown areas are mostly fields that have had fall tillage done.
Voting: Good - 3 Bad - 0
Tags: modis
23 Nov 2017 05:22 AM
Skies on Tuesday were mostly clear over Iowa, so it is a good time to check in on how we look from space. The featured map is of Aqua MODIS true color imagery and the colors over the state are rather drab. The map is rather interesting though as it shows the various land forms over the state, with forested river valleys and the dominant / intensive agricultural land use over northcentral Iowa. The darker brown areas are mostly fields that have had fall tillage done.
Voting: Good - 3 Bad - 0
Tags: modis
Fri Nov 24, 2017

Warmest Day of November
24 Nov 2017 05:53 AM
High temperatures on Friday are expected to be the warmest so far this November. The featured chart looks at the frequency of a given day of the month of November being either the warmest high or warmest low. So having the warmest high this late in the month is a bit uncommon, but has happened in the past. The warm highs look to continue into next week.
Voting: Good - 10 Bad - 0
Generate This Chart on Website
Mon Nov 27, 2017

3 inch Daily Snowfall Drought
27 Nov 2017 05:31 AM
With a hat tip to Jim Lee at NWS Des Moines, the official daily snowfall total for Des Moines has not exceeded three inches over the past 697 days. This is the longest such streak on record. The featured table highlights consecutive day stretches over 600 days for the site. For the current streak, one has to go all the way back to December 2015 to find a 3+ inch snowfall. The current prospects for snowfall are near nil over the coming week with highs well above average for today.
Voting: Good - 11 Bad - 0
Tags: snow
Tue Nov 28, 2017

Tale of Two Novembers
28 Nov 2017 05:33 AM
While the first half of November was cold, the second half has been rather warm. The featured chart looks at the combination of Des Moines average high temperature for the 1- 13 Nov period against the 15-27 Nov period. The 2017 value is highlighted and would indicate that such dichotomies are not that uncommon. The chart also contains some diagnostics looking at quadrant frequencies with the quadrants delineated by the means. While there is some correlation between the periods, a cold start to November did not doom us for a cold end of November.
Voting: Good - 6 Bad - 2
Tags: nov
Generate This Chart on Website
Wed Nov 29, 2017

Great Sunsets
29 Nov 2017 05:35 AM
The sunsets this week have been nothing sort of spectacular over much of Iowa. The IEM collected webcams have captured some awesome time lapses recently. The featured image is from the KCRG-TV webcam in Independence Tuesday afternoon. You can find recent lapses on this website and when exceptional lapses are found, they are uploaded to YouTube.
Voting: Good - 16 Bad - 6
Tags: webcam
Generate This Chart on Website
Thu Nov 30, 2017

Frost Free Days
30 Nov 2017 05:33 AM
With the period between the last spring and first fall freeze (frost free days) complete this year, it is a good time to look at the trend of this metric for Ames since 1893. The featured chart displays the yearly totals and a simple linear trend is fitted to the data. For the various climate change metrics for Iowa, this is one of the strongest signals going. This year is shown slightly above trend line and inline with the past 20 years or so of longer than average number of frost free days.
Voting: Good - 8 Bad - 2
Tags: growingseason
Generate This Chart on Website