Past Features
This page lists out the IEM Daily Features for a month at a time. Features have been posted on most days since February 2002. List all feature titles.
Fri Sep 01, 2017
Precipitable Water
01 Sep 2017 05:34 AM
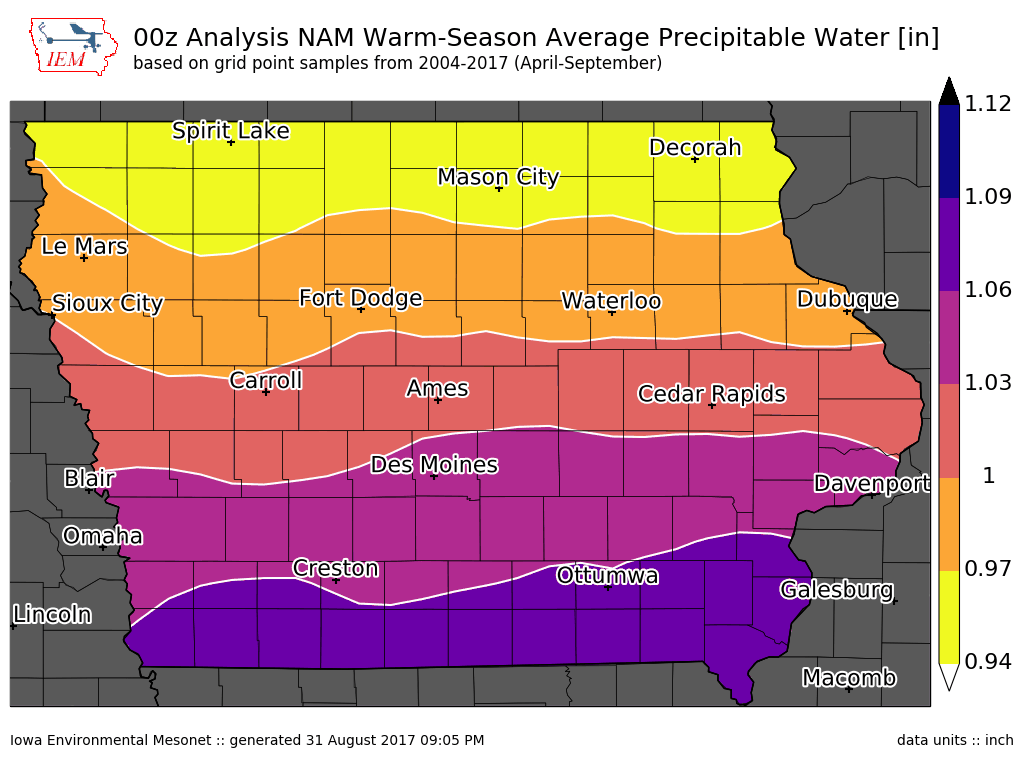
This week the daily features have been looking at precipitation climatologies for Iowa. In general, there is a northwest to southeast pattern with intensities increasing the further south you travel. One of the reasons for this gradient is the featured map for today. It shows a climatology from one of the main weather forecast models in this country for a variable known as preciptable water. This term is simply the depth of liquid water in the atmosphere above our heads if all of the water was condensed. The amount of water in the atmosphere is important to consider when looking at rainfall rates. The water coming as rain has to come from somewhere. So while the differences shown on this plot may not look large, on average a storm in southern Iowa will have about 10% more water (primarily water vapor) to work with than a storm over northern Iowa. These difference add up over the course of a year and help explain the differences in amount of rain. The observant reader may wonder why then there is not a more NW to SE gradient? Generally, that is likely more to do with the common storm track paths, which is a proxy to jet stream orientation.
Voting: Good - 21 Bad - 1
Tags: precipitablewater
01 Sep 2017 05:34 AM
This week the daily features have been looking at precipitation climatologies for Iowa. In general, there is a northwest to southeast pattern with intensities increasing the further south you travel. One of the reasons for this gradient is the featured map for today. It shows a climatology from one of the main weather forecast models in this country for a variable known as preciptable water. This term is simply the depth of liquid water in the atmosphere above our heads if all of the water was condensed. The amount of water in the atmosphere is important to consider when looking at rainfall rates. The water coming as rain has to come from somewhere. So while the differences shown on this plot may not look large, on average a storm in southern Iowa will have about 10% more water (primarily water vapor) to work with than a storm over northern Iowa. These difference add up over the course of a year and help explain the differences in amount of rain. The observant reader may wonder why then there is not a more NW to SE gradient? Generally, that is likely more to do with the common storm track paths, which is a proxy to jet stream orientation.
Voting: Good - 21 Bad - 1
Tags: precipitablewater
Mon Sep 04, 2017

Harvey Rain Rates
04 Sep 2017 06:27 AM
The featured table presents an analysis of available one minute interval precipitation observations from ASOS sites near Hurricane Harvey in Texas. While the total column simply presents the six day precipitation total, the other seven columns show the computed hourly precipitation rate based on actual totals over the given period. The chart shows some mind blowing rates experienced of over ten inches per hour at the one minute timescale and even over four inches per hour on the hourly time scale.
Voting: Good - 8 Bad - 0
Tags: hurricane precip
Tue Sep 05, 2017

Yellow Labor Day
05 Sep 2017 05:34 AM
Significant amounts of smoke from fires burning to the west of Iowa created for an interesting Labor Day Monday. Between the smoke and some clouds, temperatures were rather pleasant and a nice northerly breeze helped keep things cool as well. The smoke also made for some interesting optics as parts of the day had a very noticeable yellow tint as shown by the featured webcam image from late Monday afternoon. If you could see the sun, it appeared as a plain orange disc. A cold front and upper level system should help to sweep the smoke out of the state for Tuesday.
Voting: Good - 15 Bad - 0
Generate This Chart on Website
Wed Sep 06, 2017

Low August GDDs
06 Sep 2017 05:33 AM
The featured chart presents the combination of August Growing Degree Days and Precipitation departures expressed in terms of standard deviations from long term averages. The values are a statewide average and the 2017 totals are on the very low end of the scale for GDDs. Only three other years since 1893 come in with a lower total than 2017 according to this analysis. It will be interesting to see if heat is able to return in any force this September or if our current chilly weather will continue.
Voting: Good - 10 Bad - 0
Tags: aug17
Generate This Chart on Website
Thu Sep 07, 2017

Corn Denting Progress
07 Sep 2017 05:34 AM
The fall harvest season is soon to get in full swing. The corn crop is running somewhat behind this year. The featured chart displays yearly USDA NASS estimates of the percentage of the corn crop that is in 'dented' stage. This is one of the last development stages before harvest. The most recent analysis places 60% of Iowa's crop in this dented status and the 'x's on the plot denote the date during previous years that were at 60% as well. So we are a bit behind of 2016, but in line with the previous two years to that. It is kind of interesting to see how far 2012 sticks out. Of course, 2012 featured a drought and epic warmth, which got the crop quickly to maturity.
Voting: Good - 10 Bad - 0
Tags: nass corn
Generate This Chart on Website
Fri Sep 08, 2017

Setting new coolest lows
08 Sep 2017 05:33 AM
Iowa has seen its coolest weather of the season to date this week with crisp over night lows in the mid 40s and even some upper 30s. These days with a cooler low temperature set for the season could be considered step downs for the year. The featured chart looks at the number of step downs each year in low temperature, the temperature at which these step downs occur and the day of the year. Yes, a lot to ingest! The middle chart nicely shows the inertia to break through the freezing level as frequencies decrease as temperatures cool to near freezing. The reason being that heat is released as water freezes, so it takes extra cooling to get further below the freezing level. The bottom chart shows that this part of September is when the cooler temperatures start to show up more commonly than in August.
Voting: Good - 4 Bad - 0
Generate This Chart on Website
Sun Sep 10, 2017

Irma over Iowa
10 Sep 2017 06:11 AM
As was done a few weeks ago for Hurricane Harvey, today's featured image transposes Key West's RADAR data to Iowa to give some size perspective to Hurricane Irma. The image nicely shows extent of the eye wall, which would be bringing 100+ MPH winds all the way from Pella to Des Moines.
Voting: Good - 5 Bad - 0
Tags: hurricane
Mon Sep 11, 2017

Remembering September 11th
11 Sep 2017 06:10 AM
May we never forget the day and the lives that were lost that fateful day back in 2001.
Voting: Good - 0 Bad - 0
11 Sep 2017 06:10 AM
May we never forget the day and the lives that were lost that fateful day back in 2001.
Voting: Good - 0 Bad - 0
Tue Sep 12, 2017

Dry Two Weeks
12 Sep 2017 05:39 AM
The featured map presents an analysis yesterday of the number of days since the location observed measurable rain. The map shows most of Iowa in the two week range of values with those zeros in northwestern Iowa only amounting to a few hundredths reported on Sunday. Sometimes tropical storms are able to work their way north into Iowa, but we won't have such luck this year with neither Harvey nor Irma. About our only chance of rain in the near term is on Saturday evening, but it doesn't look all that exciting either. Our boring stretch of weather looks to continue!
Voting: Good - 7 Bad - 0
Generate This Chart on Website
Wed Sep 13, 2017

Flash Drought
13 Sep 2017 05:34 AM
The drought situation in the state continues to be very complex and difficult to analyze. A case in point is the featured image for Elkader (far NE Iowa) showing trailing 31, 91 and 365 day precipitation departures. Check out what has happened with the 31 day departure, it went from approximately +10 inches to now -3 inches in just over a month's time. That is what happens after an extremely wet period is followed up extreme dryness. The 91 and 365 departures remain well above average, so what is its current drought status? It will be interesting to see the weekly US Drought Monitor release on Thursday to see what is done in this area.
Voting: Good - 9 Bad - 0
Generate This Chart on Website
Thu Sep 14, 2017

Days to get two inches
14 Sep 2017 05:38 AM
The featured map displays the number of days you have to go back in time before accumulating two inches of rainfall since yesterday. The map shows a very localized area between Des Moines and Ottumwa that have been extremely dry this summer. The small area in black would be over 80 days (more than 2 months!). There are plenty of other dry areas analyzed in the state as well. Having to go 50+ days during the growing season with two inches or less of rain is very dry as well.
Voting: Good - 11 Bad - 2
Generate This Chart on Website
Fri Sep 15, 2017

Ottumwa Precip Ranks
15 Sep 2017 05:34 AM
Most of south central Iowa has seen very little rainfall this growing season. The featured chart looks at the precipitation statistics for Ottumwa (SE of Des Moines). The chart shows the accumulations from yesterday back to the given date, so the chart can be interrupted from right to left. The blue line represents the rank for that period with 1 being the wettest and when the line touches the dashed line, it is the driest on record. The chart shows that the entire period has seen dry conditions with accumulations since June being the driest on record. Chances of rain are at least in the forecast again, but it remains to be seen how much will fall over the driest areas of the state.
Voting: Good - 6 Bad - 2
Generate This Chart on Website
Mon Sep 18, 2017

September warmer than August
18 Sep 2017 05:32 AM
September has seen its share of warm weather, more so than what we experienced for much of August. There is a chance that this September will end up with a warmer average temperature than August. The featured chart looks at the frequency of having one month's average temperature warmer than another month for that same year. The most recent year that this happened is included for the lowest frequency cases. For the combination of interest for this daily feature, the last occurrence was in 2004 and it has happened three times overall for Ames. So this situation is somewhat rare, but not unheard of.
Voting: Good - 10 Bad - 2
Generate This Chart on Website
Tue Sep 19, 2017

Many warm, few very hot days
19 Sep 2017 05:33 AM
The featured chart looks at the number of days this year with the daily high temperature at or above a given threshold. The blue bars and labels represent the largest number of days and year at that level. For Des Moines, 2017 has seen plenty of warm days with values in the 70 to 80 degree range rather close to the largest values on record. But for warmer temperatures at 85 degrees and higher, this year has not even been close to previous warmest years. The forecast does have us adding days at these warmer temperatures for the rest of the week and even some low 90s are possible!
Voting: Good - 7 Bad - 1
Tags: highs
Generate This Chart on Website
Wed Sep 20, 2017
85+ in September
20 Sep 2017 05:32 AM
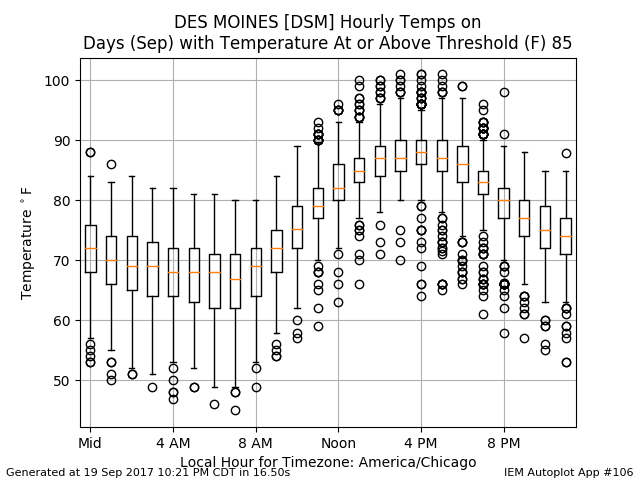
Temperatures were warm on Tuesday along with some rather muggy conditions for this time of the year. The high temperature for Des Moines reached 85 degrees after a morning low of 62. The featured chart looks at the hourly temperature distributions on days in September with the high temperature at least 85 degrees for the site. The boxes represent the 25th and 75th percentile and the whiskers are the 5th and 95th. It is kind of interesting to note the tight temperature ranges overnight on these days. Having temperatures in the 60s to start off the day are the most common. In some cases, we can warm out of starts in the upper 40s, but it is rare. The forecast looks to continue today's trend of 60s for lows and 80s for highs as it will feel like summer for a bit longer.
Voting: Good - 5 Bad - 1
Generate This Chart on Website
20 Sep 2017 05:32 AM
Temperatures were warm on Tuesday along with some rather muggy conditions for this time of the year. The high temperature for Des Moines reached 85 degrees after a morning low of 62. The featured chart looks at the hourly temperature distributions on days in September with the high temperature at least 85 degrees for the site. The boxes represent the 25th and 75th percentile and the whiskers are the 5th and 95th. It is kind of interesting to note the tight temperature ranges overnight on these days. Having temperatures in the 60s to start off the day are the most common. In some cases, we can warm out of starts in the upper 40s, but it is rare. The forecast looks to continue today's trend of 60s for lows and 80s for highs as it will feel like summer for a bit longer.
Voting: Good - 5 Bad - 1
Generate This Chart on Website
Thu Sep 21, 2017
Drought Monitor Changes
21 Sep 2017 08:22 AM
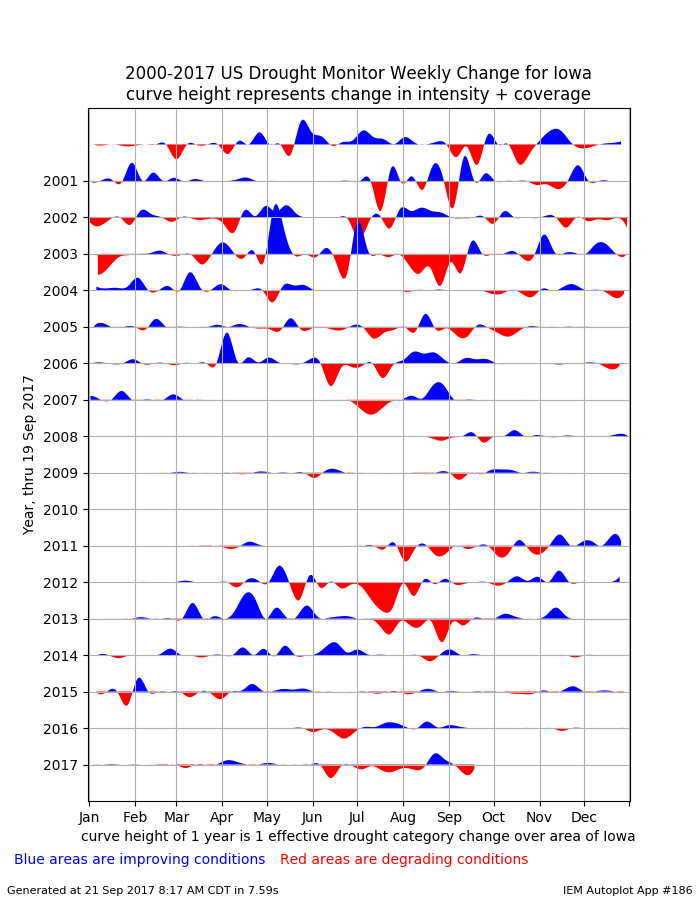
The weekly update to the US Drought Monitor was released this morning. The featured chart looks at the weekly change in drought coverage over Iowa since the product archive began in 2000. The height of the curves are a bit complex to explain and the y-axis units are being conflated with a value of 1 representing the area of the state improving or degrading one drought category. The bottom series represents this year and you can see that most of this summer has featured degrading conditions with only some improvement in August with some much needed rains falling over western Iowa.
Voting: Good - 9 Bad - 0
Generate This Chart on Website
21 Sep 2017 08:22 AM
The weekly update to the US Drought Monitor was released this morning. The featured chart looks at the weekly change in drought coverage over Iowa since the product archive began in 2000. The height of the curves are a bit complex to explain and the y-axis units are being conflated with a value of 1 representing the area of the state improving or degrading one drought category. The bottom series represents this year and you can see that most of this summer has featured degrading conditions with only some improvement in August with some much needed rains falling over western Iowa.
Voting: Good - 9 Bad - 0
Generate This Chart on Website
Fri Sep 22, 2017
Big Rain for Ottumwa
22 Sep 2017 05:05 AM
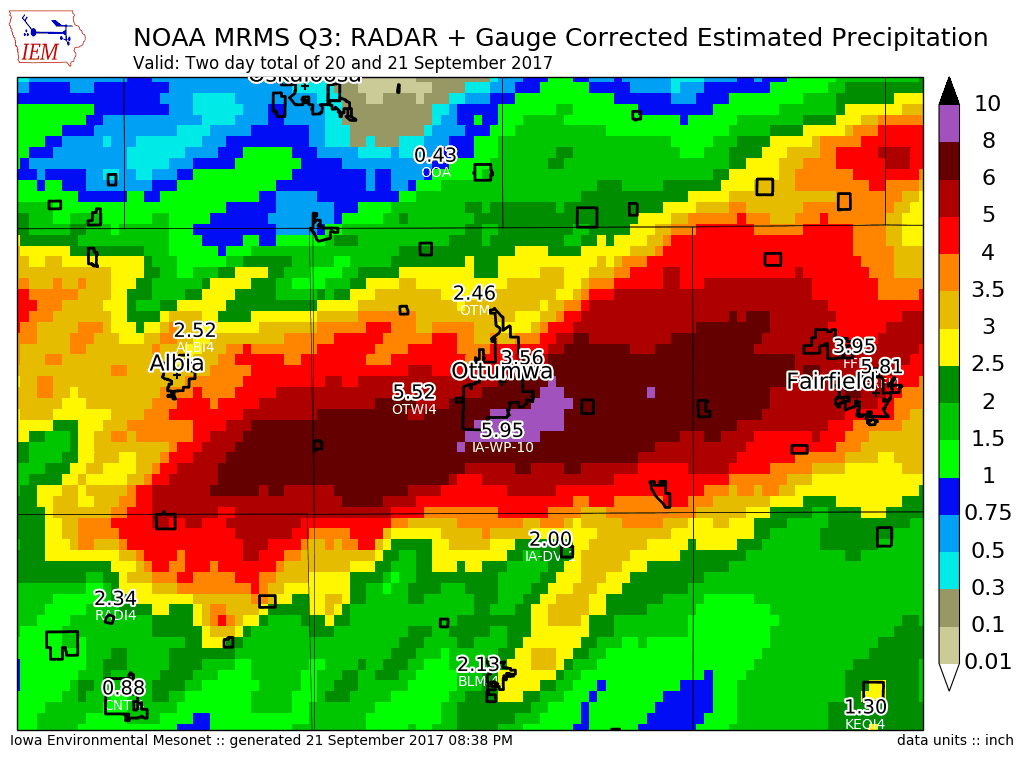
After missing most every rainfall this summer season, Ottumwa (southeast of Des Moines) took a direct hit on Wednesday night into Thursday morning. The featured map displays the combination of MRMS precipitation estimates and reported totals. The Ottumwa airport is north of town and only reported 2.5 inches, while stations on the southern end of town reported 5 to 7 inches. The MRMS estimates are a bit on the high side of those reports, but still nicely shows the pattern over the city (black outline on the map). The rain came so quickly it was even able to produce some flooding in the area.
Voting: Good - 10 Bad - 1
22 Sep 2017 05:05 AM
After missing most every rainfall this summer season, Ottumwa (southeast of Des Moines) took a direct hit on Wednesday night into Thursday morning. The featured map displays the combination of MRMS precipitation estimates and reported totals. The Ottumwa airport is north of town and only reported 2.5 inches, while stations on the southern end of town reported 5 to 7 inches. The MRMS estimates are a bit on the high side of those reports, but still nicely shows the pattern over the city (black outline on the map). The rain came so quickly it was even able to produce some flooding in the area.
Voting: Good - 10 Bad - 1
Sat Sep 23, 2017

4,000th Feature
23 Sep 2017 09:02 AM
This post marks the 4,000th IEM Daily Feature! This series started back in 2002 as a means to highlight things happening in weather and climate for Iowa. The once daily posts matured over the years to include Facebook feedback, voting, and reproducible science. The image associated with this feature is known as a word cloud. It summarizes the 3,999 previous feature posts with the most common words appearing in the largest font sizes. Thankfully, the word Iowa ranks near the top! As always, let me know how this feature series can be improved and more relevant for your needs. Thanks for following!
Voting: Good - 29 Bad - 1
Tags: iem
Tue Sep 26, 2017

Latest Warmest Stretch of the Year
26 Sep 2017 05:34 AM
A cold front has swept the state clean of the summer like air mass that has dominated our weather for the recent few days. High temperatures during this period were remarkably warm with values in the low 90s for most. In fact, over the recent five day stretch, places like Cedar Rapids had its warmest five day stretch of the year. The featured chart presents the warmest such periods each year along with a histogram of the day of the year that participated. The period this year shows up the furthest to the right (latest in the year) and a descent separation from the previously latest in mid September. More early Fall like temperatures are back for the rest of the week.
Voting: Good - 7 Bad - 1
Generate This Chart on Website
Wed Sep 27, 2017

September 90+ Days
27 Sep 2017 05:34 AM
The cold front on Monday gave us a break from the very warm conditions for late September. For Des Moines, five days this month were 90+ degrees for high temperature. The featured chart displays the number of 90+ degree days for September. While having five days is double the long term average, there have been plenty of recent years with as many days and the record number of sixteen days is triple of 2017. It remains to be see if we will hit 90 degrees again this fall, but very warm weather looks possible was we start off October.
Voting: Good - 9 Bad - 0
Tags: sep
Generate This Chart on Website
Thu Sep 28, 2017

2017 Corn Harvest Progress
28 Sep 2017 05:31 AM
The corn harvest has yet to get underway this fall for Iowa. The featured chart displays USDA NASS estimates of corn harvest progress for the state. The latest number for Iowa is 3% harvested and the three percent value each previous year is denoted by an X. This year's progress is about on par with previous years, except 2012 of course. Recall that 2012 was a drought with epic warmth, so the crops reached maturity extremely early. The harvest of 2009 really sticks out as well with the harvest lasting well into December.
Voting: Good - 10 Bad - 0
Tags: corn
Generate This Chart on Website
Fri Sep 29, 2017

September 70+
29 Sep 2017 05:37 AM
Temperatures were again very pleasant for late September on Thursday with highs well into the 70s. This September has seen plenty of hours with the temperature at or above 70 as shown by the featured chart for Des Moines. The top panel shows the number of hours for the month based on hourly observations and the bottom panel shows the frequency that a given hour for the month was at 70+ degrees. It is interesting to see the largest three values happening over the past three years since 1973. Of course, there is still time for the 70s total for this September to further accumulate with highs expected in the low 70s for both days.
Voting: Good - 7 Bad - 0
Generate This Chart on Website