Past Features
This page lists out the IEM Daily Features for a month at a time. Features have been posted on most days since February 2002. List all feature titles.
Tue May 01, 2018

Dry April for Southern Iowa
01 May 2018 05:34 AM
April has come to a merciful end for Iowa. What a month! The first two thirds of the month were nearly the coldest on record with round after round of heavy snow fall over northern Iowa. The featured map looks at precipitation total ranks by climate district based on IEM estimated values. This analysis places southeastern Iowa as having the second driest April since 1893. As is typically the case for these types of plots, one needs not look very far to find wet areas over central Wisconsin and especially eastern Ohio. It will be interesting to see how much rain falls this week from the storms that are in the forecast.
Voting: Good - 11 Bad - 0
Tags: apr18
Generate This Chart on Website
Wed May 02, 2018
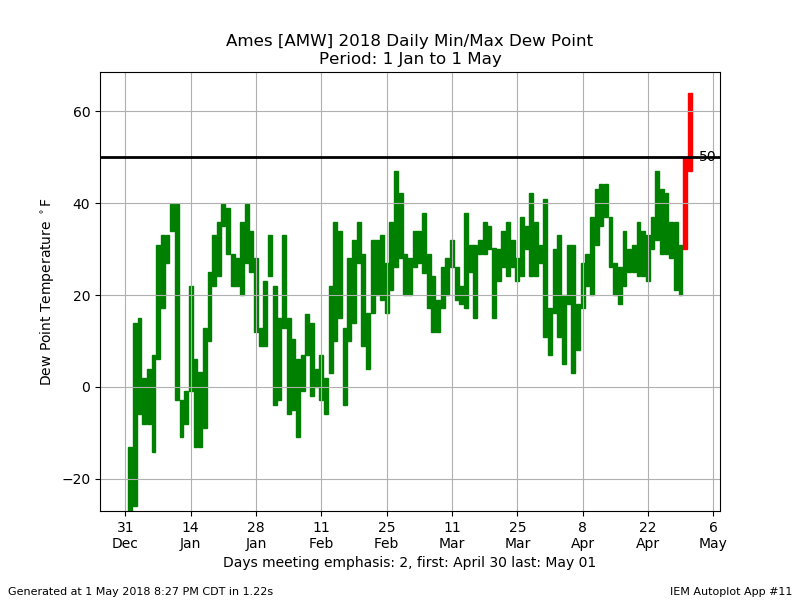
Finally, some humidity
02 May 2018 05:32 AM
The past few days have seen not only the warmest temperatures of the year, but also the highest dew point readings. The featured chart depicts the daily range between the minimum and maximum dew point temperature for Ames. Any day with the range at 50 or above is highlighted in red. Amazingly, only two days are shown and those are the past two days! So on April 30, it was the first day with a dew point above 50 and Tuesday was the first day above 60. At this rate, the muggiest summer dew points of 80 will be here on Thursday! It is no coincidence that all this moisture is helping to fuel thunderstorms which are bringing heavy rainfall to the state.
Voting: Good - 8 Bad - 0
Tags: dewpoint
Generate This Chart on Website
Thu May 03, 2018

Weekly Corn Planting Progress
03 May 2018 05:33 AM
The spring planting season in Iowa has been a struggle. The epic cold and snow of April delayed the onset and widespread rains this week will further delay activity. There was a window of about seven days last week into early this week that allowed for some progress to me made. The featured chart looks at USDA NASS reported weekly crop progress reports since 1979 for Iowa. The estimates are updated by the USDA weekly and the chart shows the yearly progress by day of the year with the top panel and the maximum weekly change each year with the bottom panel. The bottom panel casts some doubt on the perception that farmers are getting the corn crop in faster thanks to bigger and faster equipment. While certainly the size and speed of corn planters has increased since 1979, the number of acres planted per planter has dramatically increased as well.
Voting: Good - 12 Bad - 0
Tags: corn nass
Fri May 04, 2018

Cover Crop GDDs
04 May 2018 05:34 AM
Planting cold season cover crops after harvest has certainly taken off over recent years in Iowa. The success of these crops is highly dependent on how much warmth and rain is present after the harvest as well as the following spring season. The featured chart presents Growing Degree Day (GDD) totals between 15 October and the following 30 April for Mason City. For the context of a common cover crop of cereal rye, the GDD base of 40 degrees is chosen. The year labelled for the plot is the year of the 15th of October included in the period, so this past year's 2017 total shown is rather meager and about 200 units below long term average. The bottom panel presents the distribution of yearly totals with this recent year's total at about the 95th percentile for lowest value.
Voting: Good - 9 Bad - 0
Tags: gdd covercrop
Generate This Chart on Website
Mon May 07, 2018

First Widespread Half Inch
07 May 2018 05:34 AM
Last week was our first significant wide spread rainfall event of the season as depicted by the featured chart. The top panel shows the areal coverage within the state that picked up at least a half of an inch over a trailing seven day period. The bottom panel looks at the efficiency of that rainfall with the tan area representing how much of the precipitation fell over an area that was sub half an inch prior to the event. Complexity of the plot aside, the recent week of rains were needed over much of the state, but some parts of the state, particularly northern Iowa need some more dry weather.
Voting: Good - 8 Bad - 0
Generate This Chart on Website
Tue May 08, 2018

Some Drought Help
08 May 2018 05:32 AM
The weekly US Drought Monitor is released every Thursday and considers rainfall up until 7 AM the prior Tuesday. So the featured map combines the previous seven day precipitation totals and last week's US Drought Monitor analysis. The cross-hatched areas are in D0 status and the single slash are in D1. The map shows that some of the analyzed drought area picked up some significant rains, but other parts did not. Some of the driest areas in southern Iowa missed out again on the heaviest totals. The national drought monitor attempts to paint the drought analysis with broad brush strokes, so these fine scale precipitation totals make for a difficult analysis. These rainfall totals are also heavily based on RADAR, which can sometimes over-estimate and sometimes under-sample precipitating storms. Another confounding issues is that water demand is steadily increasing as the growing season cranks into full speed, so it takes an inch or so of rainfall just to keep pace with that demand.
Voting: Good - 11 Bad - 0
Generate This Chart on Website
Wed May 09, 2018

Low SPC Watch Total
09 May 2018 05:32 AM
While there have been a few active days this year, the severe weather season has been rather quiet to date thus far. The featured chart depicts the number of Storm Prediction Center issued Severe Thunderstorm and Tornado Watches for the year to date period each year since 1997 (start of modern period of record). This year's total is just about half the total of the previous lowest accumulation year.
Voting: Good - 12 Bad - 0
Tags: spc 2018
Thu May 10, 2018

Streaks above 60
10 May 2018 05:34 AM
Since the weather straightened out back in late April, daily temperatures have remained consistently warm. For Ames, we are currently at a streak of 18 days with the daily high temperature above 60 degrees. The featured chart looks at the longest such streak of days by day of the year. For early May, there have been longer streaks than the current one by about 14 more days. This streak may be in a bit of danger of breaking on Saturday, but otherwise looks to keep going.
Voting: Good - 6 Bad - 1
Generate This Chart on Website
Fri May 11, 2018

Next Five Days
11 May 2018 05:33 AM
The featured map combines the five day precipitation forecast from the Weather Prediction Center and the most recent US Drought Monitor analysis. The heaviest totals on this map are unfortunately over areas that don't really need the rain currently and rather need dry weather to make spring planting progress. The driest areas over southern Iowa may get some needed rain, but the even drier areas to our southwest look to mostly miss out on the stormy pattern over the next few days.
Voting: Good - 11 Bad - 0
Tags: wpc
Generate This Chart on Website
Mon May 14, 2018

Rainy May
14 May 2018 05:33 AM
This May has seen plenty of rainfall events. The featured map displays an analysis of the longest stretch of hours between periods of measurable rain. This is based on hourly RADAR based estimates of rainfall from the NOAA Stage IV product. The plotting unit of days should not be confused with calendar days, but simply the maximum stretch of hours expressed in units of 24 hour days. The areas in blue are indicated to have only gone, at most, between 48 and 72 hours between measurable rainfall events this May. The rest of the state has not fared much better, but there have been plant-able stretches of time.
Voting: Good - 15 Bad - 0
Tue May 15, 2018

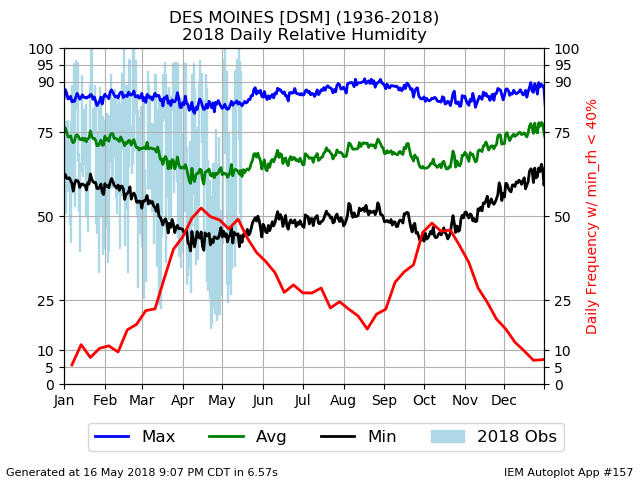
Lowest Average April Dew Point
15 May 2018 05:33 AM
It is remarkable how May has turned out different than April. Humidity and storms returned in full force after a noticeable absence during April. Not only was it one of the coldest Aprils on record, it was also low for humidity. The featured chart displays the monthly average dew point temperature for Des Moines. The 2018 value is well below any previous April.
Voting: Good - 8 Bad - 0
Tags: apr18
Generate This Chart on Website
Wed May 16, 2018

Clouds headed west
16 May 2018 05:34 AM
The observant weather watcher on Tuesday may have noticed the fair weather cumulus clouds headed west during the afternoon hours over central Iowa. This is somewhat rare as our winds aloft are generally blowing easterly. An easy way to assess the frequency of this happening is to look at wind roses for available upper air sounding sites. The featured image presents such a wind rose for Omaha at the 850 hPa level. This level is approximately where the clouds were on Tuesday. The 7 PM sounding from the site reported an east-northeast wind at that level and the wind rose would indicate this is the least frequent wind direction during May based on period of record data.
Voting: Good - 8 Bad - 0
Tags: windrose sounding
Generate This Chart on Website
Thu May 17, 2018
Daily RH%
17 May 2018 05:34 AM
The weather over the past few days has been near perfection with warm temperatures, low humidities, and a light breeze. One of the measures of humidity is relative humidity (RH). The RH percentage is somewhat difficult to directly interpret as it does not account for temperature. That aside, the featured chart looks at daily climatology of RH based on period of record data for Des Moines. The red line represents the daily frequency of having the minimum RH below 40%, like it was on Wednesday. This line depicts a clear seasonal cycle with frequencies peaking during mid Spring and mid Fall. This is one of the reasons folks tend to like these two times of year as temperatures are generally warm and humidities are lower like it currently is.
Voting: Good - 4 Bad - 0
Tags: rh
Generate This Chart on Website
Fri May 18, 2018

Just 39
18 May 2018 05:34 AM
After one of the coldest Aprils on record, temperatures this May have been very mild. The featured map displays the minimum 2018 May temperature based on IEM tracked long term climate sites. The coldest temperature you can find on this map is just 39 degrees. This ranks as one of the mildest May to date minimum temperature for Iowa on record since 1893. The current temperature outlook for the rest of the month looks to continue the mild temperatures with no significant cold in sight.
Voting: Good - 10 Bad - 0
Tags: may18
Generate This Chart on Website
Mon May 21, 2018

May Clouds
21 May 2018 05:34 AM
The featured chart is an attempt to show hourly cloud reports from the Des Moines Airport. The shared regions are based on reported cloud coverage amount and base level. The darkest region would indicate overcast conditions. Yesterday, on Sunday, clouds were rather low and created overcast conditions for most of the day. The chart nicely summarizes our May with two stretches of rather clear conditions and periods of mostly cloudy.
Voting: Good - 8 Bad - 1
Tags: may18 clouds
Generate This Chart on Website
Tue May 22, 2018

Best Time for Fog
22 May 2018 05:35 AM
Dense fog is present over much of Iowa this Tuesday morning. The featured chart looks at the frequency of reported fog based on hourly observations from the Ames Airport. This analysis would place late May as one of the least frequent times of year for fog for the site. The side and bottom panels show the hourly and weekly histograms. Of course, fog is most common during the early morning and pre-dawn hours as the atmosphere cools and the air becomes saturated.
Voting: Good - 11 Bad - 0
Tags: fog
Generate This Chart on Website
Wed May 23, 2018

Besting May 1934
23 May 2018 05:32 AM
After one of the coldest April's on record, the very next month of May is taking a run at being one of the warmest May's on record. The featured chart looks at scenarios for beating the current statewide warmest May of 1934, according to IEM unofficial accounting. This year's time series is appended with a scenario for each of the previous years during the 23 to 31 May period. None of these scenarios end up beating 1934, but the forecast has very warm temperatures as it will feel like summer to end the month.
Voting: Good - 3 Bad - 1
Tags: may18
Generate This Chart on Website
Thu May 24, 2018

May Precipitation Departures
24 May 2018 05:37 AM
The featured map depicts precipitation departures from average so far this May based on NOAA MRMS precipitation estimates and gridded long term climatology. Some areas of the state are depicted very wet, like most of Northern Iowa, and some areas are very dry. Of notice for locals to Ames is the dry area just to our northwest which includes much of the northern part of the city. As temperatures continue to warm and precipitation chances look rather meager, the areas that missed out on the rainfalls of May will be stressed even further.
Voting: Good - 8 Bad - 1
Tags: may18
Generate This Chart on Website
Fri May 25, 2018

Week Early for 90
25 May 2018 05:34 AM
Some of the warmest temperatures so far this year were experienced on Thursday with a few locations, like Ottumwa hitting 90 degrees for the first time. The featured chart looks at the climatology of year to date maximum temperature for the site. The average first 90 is about the first of June, so this was about a week ahead of schedule. The near term forecast looks hot, so it will be interesting to see if spring like temperatures will return or we have slipped right into summer. Of course, Memorial Day weekend is considered the start of summer as well!
Voting: Good - 12 Bad - 0
Generate This Chart on Website
Sun May 27, 2018
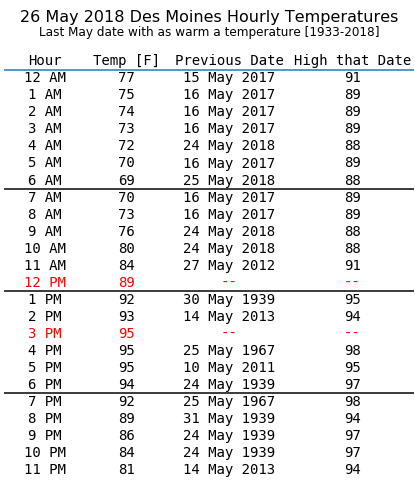
Hot May Saturday
27 May 2018 06:41 AM
The heat is on for the Memorial Day weekend and temperatures on Saturday were some of the warmest on record for May. The featured table shows the hourly temperature reports from the Des Moines Airport and the previous May date with as warm or warmer temperature for that hour. The noon and 3 PM temperatures were the warmest on record, which dates back to the early 1930s for hourly temperature reports. Today will be even warmer yet with some locations taking a run at 100 degrees.
Voting: Good - 5 Bad - 1
Tags: may18
Mon May 28, 2018

Eight Degree Beat
28 May 2018 06:02 AM
Sunday was another scorching hot day for May with record high temperatures set over much of Iowa. Des Moines hit 99, which beat its previous record high temperature for the date by eight degrees. The featured chart looks into the magnitude of the daily record set for Des Moines with high temperature beats shown in red and low temperature beats shown in blue with negative values indicating the amount the low temperature decreased by for the new record. Of course, when you are first writing the record books, the record setting amounts are large as the period of record is so short.
Voting: Good - 8 Bad - 0
Generate This Chart on Website
Tue May 29, 2018

Plenty of Heat
29 May 2018 05:32 AM
It is amazing to think that only a month ago, we were dealing with one of the coldest Aprils on record and numerous snow events. Fast forward to May and the heat has been on in a big way and record high temperatures were set each day of the Memorial Day weekend. The featured chart looks at the number of hours with the heat index at or above a given level for the year to date period. The long term average is plotted as well. This year's accumulated hours is well above long term average, particularly at the high end. We still have a few more hot days to go prior to a return to temperatures closer to average.
Voting: Good - 11 Bad - 1
Generate This Chart on Website
Wed May 30, 2018

90s in May are rare
30 May 2018 05:32 AM
The very hot for May conditions continued on Tuesday with 90s common over much of the state. Having 90 degree temperatures in May is not very common. The featured chart depicts the frequency of hourly temperature by week of the year. The red area represents temperatures at 90 degrees and higher. For the weeks within May, this bin is not even noticeable. The last two days of May look to continue our hot stretch of weather.
Voting: Good - 11 Bad - 0
Generate This Chart on Website
Thu May 31, 2018

All May above average
31 May 2018 05:30 AM
The last day of May will continue the recent trend of very warm weather. The featured map presents the number of consecutive days with the daily high temperature above the present 30 year period average. A few locations on this map will finish the entire month of May with above average daily high temperatures for each day. One needs not travel far south of Iowa to find such locations as Kirksville and Columbia, Missouri. Plenty of heat and humidity will be present on Thursday and into Friday.
Voting: Good - 8 Bad - 1
Tags: may18
Generate This Chart on Website