Past IEM Features tagged: fall

Last Fall Dates
15 Sep 2023 05:30 AMYesterday's Daily Feature presented the frequency of having observed a given low temperature by a fall season date. Today's plot shows the opposite with the frequency of having observed the last high temperature of a given threshold by the fall season date. For example, about 50% of the years observed the last day of at least a 85 degree high temperature by today. Or rewording, only about 50% of years on record experienced a 85+ degree high temperature later than today's date. It is interesting to note the relative distance between the 85, 80, and 75 degree lines. Certainly reaching 85 degrees is a bit more difficult this time of year than making it to 80. The right hand table shows the percentile dates along with the min and max dates. You may recall that 15 December 2021 (ob taken 7AM on 16th) event shown as the last 70 degree day when crazy warmth and a serial Derecho impacted the state!
Voting:
Good: 16
Bad: 1
Tags: fall

First Fall Dates
14 Sep 2023 05:30 AMWhile some isolated locations in northwestern Iowa have dipped into the 30s, there has yet to be any sub 32 degree temperatures in the state so far. Having said that, we are now at the time of the year that such values are possible based on climatology. The featured chart presents the accumulated frequency and percentile dates of having the first fall low temperature at or below the given threshold by the given date of the year for Ames. The table lists the percentiles along with the earliest and latest calendar dates at the given threshold. For Ames, you can see the first 32 happened on 13 September 1902, which was yesterday for a calendar date! You can see that the frequencies rapidly increase by the day. Values well below 32 though don't start rapidly increasing until October. You can generate this chart for other locations and thresholds of your choice by following the "Generate this chart" button.
Voting:
Good: 12
Bad: 0
Tags: fall

Is it fall?
01 Sep 2022 05:30 AMThe date that ends the summer season is always debatable. Some say 31 August, others say Labor Day Monday, and others say 21 September. Is there a way to quantify this? Well, if you consider the hottest 91 day and coldest 91 day stretch of days over a given period of time, what drops out in between those two periods can be assigned spring and fall. The featured chart does just that with the top panel showing the trailing 91 day average temperature for Ames, the middle panel showing the date of maximum trailing value each year on record, and the bottom panel showing the number of days between this start date and the start date of the coldest 91 days (the length of fall season). So the 2022 value appears to have presently peaked for Ames back on 29 August, but the near term forecast has temperatures that may allow this value to peak again over the coming days as early June was rather chilly (warmer days in Sept replacing colder days in June for the 91 day average). That ambiguity aside, the bottom panel is sort of bad news for fall season lovers as it indicates the average length is only 86 days, so less than an equally split season around 91 days.
Voting:
Good: 10
Bad: 1
Tags: fall

Already Fall
08 Sep 2021 05:32 AMA cold front swept the state clean of humid air on Tuesday and brought a definite fall like feel with brisk northwesterly winds. Are we already in the fall season? Depending on who you ask, the start of fall is either Sep 1, Labor Day, Sep 22, or some other arbitrary date. Since we like to feature statistical plots on this website, the featured chart presents the trailing 91 day average temperature for Ames. The maximum value plotted each year would represent the warmest consecutive 91 day period each year, which perhaps could be considered the actual summer season! The 2021 value appears to be set now with the peak on 2 September and not much chance of pulling that average higher over the coming days. The second panel displays some metrics with how this end of summer / start of fall date has changed over the years with a slight positive trend.
Voting:
Good: 10
Bad: 0
Abstain: 1
Tags: fall

Perfect Fall Weather
08 Oct 2019 05:34 AMThe weather on Monday was near fall perfection for Iowa with highs generally in the 70s, light winds and low humidity. The featured chart presents the daily probability of having a high temperature in the 70s, a daily average wind speed below 10 MPH, and a maximum dew point below 50 based on available hourly observations for Des Moines. The black line represents the combined frequency of all these three parameters. This combination is generally limited by elevated humidity levels during the summer season and cooler temperatures during the cold season. This is the time of year for this combination, so enjoy it while it lasts!
Voting:
Good: 3
Bad: 0
Tags: perfect fall combo

Fall Inch Precip Days
05 Nov 2018 05:35 AMMany locations in Iowa, like Dubuque, have seen more than its fair share of heavy rainfall events this fall season. The featured chart displays the number of days with at least one inch of precipitation reported for the fall season encompassing September thru November. Dubuque reported an inch on Sunday bringing its season total to six days this season. The long term average is shown and at just two days. The heaviest rainfall this week is forecasted to stay to our south and east.
Voting:
Good: 9
Bad: 0
Tags: fall
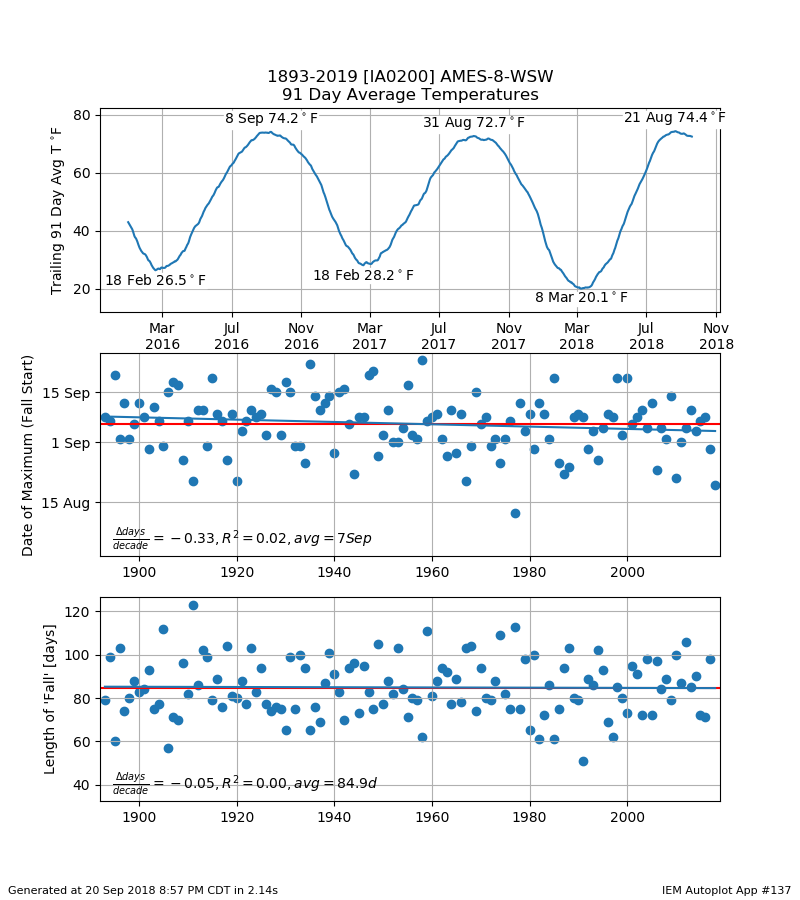
A month of Fall Already
21 Sep 2018 05:34 AMThe Fall Equinox is on Saturday and thus starts the astronomical fall season. The weather recently has certainly felt more like the middle of summer than early fall recently, but thankfully a cold front swept the state clean of the hot and muggy air overnight. Of course the definition of the seasons is arbitrary, but if one considers the warmest consecutive 91 day period each year as the summer season then the start date of the fall season can be determined. The featured chart does that calculation and shows that the trailing 91 day average temperature peaked back on 21 August! That means we have had a month of the fall season already! The bottom two panels show some metrics on the fall season and the average number of days shown in the bottom panel show the fall season averaging only 84 days. This weekend looks to be awesome fall weather, so enjoy it before winter comes.
Voting:
Good: 8
Bad: 1
Tags: fall

Fall Highs Above Average
04 Dec 2017 05:32 AMThe fall season encompassing the full months of Sep, Oct, and Nov wrapped up last week. The featured chart looks at the percentage of days for the period that had a high temperature above average. The overall average is plotted as well and is slightly different than an even 50% due to asymmetries of the high temperature distribution. Anyway, years above this value are shown in red and below in blue. This fall was near 50% whereas the previous two where much higher for Ames. It has been about 20 years since the last fall season with substantially lower than 50% of the days above average for the fall season.
Voting:
Good: 6
Bad: 2
Tags: fall

Fall Season Precipitation
04 Oct 2017 05:25 AMThe featured chart displays fall season (September thru November) total precipitation for Ames. The past three years have seen above long term average precip for the period and this year's seasonal total appears to be on its way with ongoing rain now and still just under two months of time left. A long term trend line is fitted to the data and would indicate little trend with these totals.
Voting:
Good: 6
Bad: 0
Tags: fall
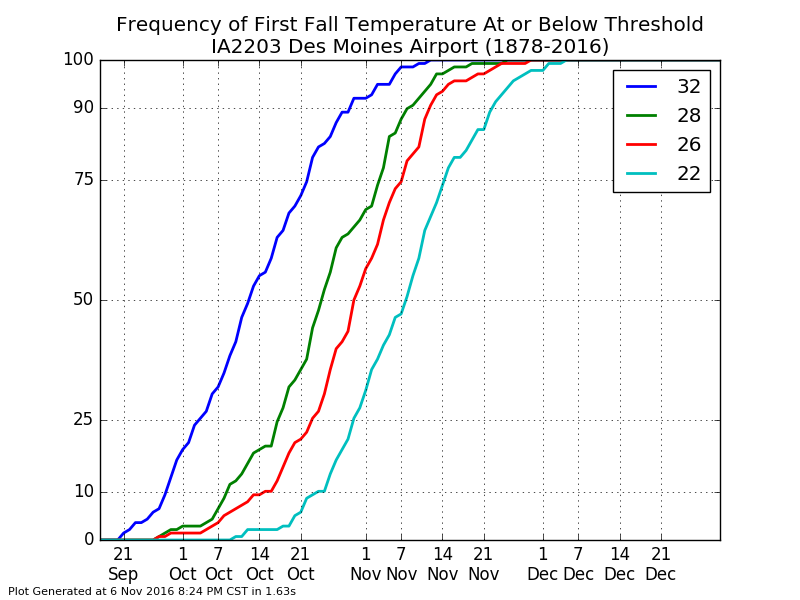
First Fall Temp Frequencies
07 Nov 2016 05:35 AMFor the Des Moines Airport weather station, a freezing temperature has yet to be observed this fall season! This is getting very late into the year to have seen such a cold temperature. The featured chart shows the accumulated frequency of having a given temperature observed by the given date of the fall season. For November 7, nearly all years have seen a freezing temperature and even 75% of them have seen 26 or colder by now. The forecast continues the nice weather this week, with slightly cooler temperatures and perhaps a chance at a freeze later in the week.
Voting:
Good: 8
Bad: 2
Tags: fall

Freezing Time
21 Oct 2016 05:34 AMThe featured chart presents an analysis of duration and strength of the first fall periods at or below freezing for Des Moines based on one minute interval temperature observations since fall 2000. Each event represents a sequential fall date during which the low temperature reached 32 degrees or colder. For example, event three would be the third day during the fall season at or below 32. The time duration is the period between when the temperature hit 32 degrees and rose back above 32. The maximum duration period for each date was used in cases of multiple periods on a given date. The box and whisker plots represent the spread of duration. A strength metric is also calculated and is simply the temperature difference from 32 multiplied by time. So what is the moral of the story here? The initial dips below freezing are brief (1.5 hours on average) and shallow. Both the duration and "depth" increase with sequential event with more noise than signal appearing after the fourth or fifth event.
Voting:
Good: 7
Bad: 2
Tags: freeze fall

Has Fall Already Started?
29 Aug 2016 05:36 AMIf one considers the summer season to be the warmest 91 day stretch of the year, we may already completed it as shown by the featured chart for Ames. Currently, August 24th is denoted as the end of the warmest 91 day period, but it could change with hot weather pulling the average back up and thus establishing a new high mark for the year. Regardless, the chart also displays some statistics on the start date of fall and how long the season lasts. The length is defined as the period between the end of the 91 day warmest stretch and then the start of the 91 day coolest stretch. The averages show that fall goes by more quickly than spring with an average of 85 days!
Voting:
Good: 14
Bad: 0
Abstain: 2
Tags: fall

Fall Season 70s
04 Nov 2015 05:36 AMEarly morning fog put a bit of a damper on an otherwise great November day with temperatures again reaching 70+ degrees for much of Iowa. The featured chart presents the number of days each meteorological fall season that the high temperature was at or above 70. This year's total is the second largest since the early 1960s. Today will be another warm day before cooler weather arrives tomorrow!
Voting:
Good: 10
Bad: 3
Abstain: 4
Tags: fall 70

Warm Mins to Date
30 Oct 2015 05:35 AMSo far this fall season, we have avoided very cold temperatures. For Des Moines, the to date minimum has only been 36 degrees. The featured chart displays the fall to date minimum temperature this year along with a climatology of this metric. 36 was also the to date minimum last year for this date. The range of values shows that only a few events have been warmer to date and that value is only 37. If the current minimum of 36 holds until 7 November, it would be the warmest minimum temperature this far into the fall season. A caveat for the Des Moines Airport site, is that there is a clear urban heat island effect there and so its temperatures are often warmer than surrounding areas.
Update: The low this Friday morning dipped to 34, so the 36 mentioned aboved has already been breached.
Voting:
Good: 22
Bad: 23
Abstain: 5
Tags: fall

Stepping Down
30 Sep 2015 05:36 AMSome of the coolest air this season has settled into Iowa overnight with temperatures stepping below previous lows for the fall season. The featured chart presents some diagnostics of these step downs in temperature with the 'step down' representing the setting of a new (since 1 July) cold temperature for the year. The average number of these events is around 19 for Des Moines, which is roughly one out of every ten days for the half year period. The second and bottom charts present histograms of the temperature levels and day of year whereby these steps occur. The increased frequencies at the start of July is an artifact of the algorithm, but there is a clear jump around mid September, which is about the time cooler air masses start arriving. There is also increased frequencies in the 50s, which is a temperature a bit lower than our supporting/typical 60 degree dew points in the summertime. There is also another jump just below freezing. These are levels that it takes a bit of time to push through as dew point and non-frozen soils offer resistance to cooling below those levels.
Voting:
Good: 7
Bad: 11
Abstain: 3
Tags: fall spring

Fall Minimum to Date
09 Oct 2014 05:39 AMThe featured chart displays the climatology of minimum to date temperature for dates after 1 July. The trace for this year is shown as well for Ames. This year saw a very cold temperature arrive in mid September and we have only recently breached that level lower. As it stands now, we are about at average for the minimum temperature to date. You can generate this chart dynamically on the website and plot previous years for comparison.
Voting:
Good: 17
Bad: 6
Abstain: 8
Tags: fall

No freeze yet
08 Oct 2013 05:37 AMThis is about the time of year by which much of Iowa has experienced its first freezing temperature. The featured chart presents the year to date lowest temperature after 1 July climatology for Ames. While not strictly the same metric, the intersection of the black line (average lowest temperature to date) and dashed line (freezing temperature) around this time approximately matches the average first freezing temperature of the fall. The minimum to date temperature for this year shows that we are well on the warm side of long term average. The shaded areas represent the percentile ranges of 50% and 95% of the daily data. The red line should remain flat for at least the next seven days with low temperatures well above 40 degrees.
Voting:
Good: 46
Bad: 16
Tags: fall freeze low

First Fall Hard Freeze Climatology
14 Dec 2011 05:48 AMHaving air temperatures at or below 28 degrees Fahrenheit are often considered to be a 'killing frost' event. It is not an exact science and very small scale processes occur to kill or protect the plant, anyway the featured chart presents the the frequency of having such a cold temperature by a given date in the fall season. For example, Waukon has seen the first hard freeze roughly 70% of the years prior to 1 November. There is a variation of just around a month from the earliest to latest in the state. In fact, Fort Madison made it till 9 December back in 2001 before hitting such a cold temperature.
Voting:
Good: 23
Bad: 3
Tags: fall frost

Can't catch 1966
28 Oct 2011 05:55 AMSo far, Des Moines has had its 12th driest meteorological fall on record. The featured chart presents the precipitation rank to date since the first of September for this year, 1914 (the wettest year) and 1966 (the driest year). If we got no precipitation for the rest of the season, our fall total would still be a bit higher than 1966 and coming in second lowest. The forecast has some chances of rain in the forecast next week.
Voting:
Good: 32
Bad: 7
Tags: 2011 fall

Cold Expectations
21 Oct 2011 03:49 AMYesterday the chances of seeing warm high temperatures yet this year were featured, so naturally it is time to do the opposite and see how cold it will get in the next two and a half months. About 80% of the years since 1893 have seen at least one day with a low temperature around zero and about 7 days at 10 degrees. Thankfully, the near term forecast does not have temperatures approaching anything on the chart.
Voting:
Good: 26
Bad: 5
Tags: fall

How much warm weather is left?
20 Oct 2011 05:56 AMWith our recent few days of temperatures well below average, one wonders how many warm days are left this year! The featured plot presents the observed frequency of having a given number of days with a high temperature at or above a given temperature from now until the end of this year. For example, 80% of the years since 1893 experienced a high temperature of 70 on at least one day, but only 20% of the years experienced a total of 7 days at 70. The forecast puts us back into 60s after a chilly day today in the lower 50s.
Voting:
Good: 16
Bad: 3
Tags: fall

Fall Duration
03 Dec 2010 05:46 AMFollowing up on the previous day's feature, today's featured plot presents an IEM computed metric of the climatological duration of the fall season. The number of days presented represent the time between the warmest 91 day period and coolest 91 day period based on daily climatological high and low temperatures. Think of it as the number of days it takes to get from the warmest quarter of the year to coolest. Iowa is shown right around 90 days, which is about what one would expect for having evenly distributed seasons. The plot would suggest that if you like the fall, don't live on the west coast!
Voting:
Good: 47
Bad: 12
Tags: fall temp

Warm weather after frozen day
29 Nov 2010 05:46 AMLast week saw two days with most of the state below freezing for the entire day. For Ames, this made for the first such day this fall. Having such a day does not mean cold despair for the rest of the year as illustrated by the featured chart. Even after the first frozen fall day, temperatures many times still nicely warm sometime before 31 December. Highs on Sunday were a case in point as values soared into the 50s. The forecast for this week pushes high temperatures back toward freezing.
Voting:
Good: 21
Bad: 6
Tags: fall

Fall's Tug on Climatology
24 Sep 2010 04:59 AMThe fall season is officially here in Iowa eventhough the actual weather feels more like the muggy days of summer. The featured map presents the three week change in climatological average high temperature over the US. The map nicely shows where fall makes its fastest progression (high plains and mountain regions) this time of year. Places like Florida are only slightly affected thanks to the moderating effects of being surrounded by warm water. The corn belt makes a conspicuous appearance in this plot as an area cooling slower than areas to its north and west.
Voting:
Good: 72
Bad: 11
Tags: fall

A bit early for cold
31 Aug 2009 06:06 AMLow temperatures this weekend were in the 40s and even upper 30s in some locations. The featured chart shows the frequency of experiencing a given threshold temperature by a certain date in the fall for Ames. While having a low temperature in the upper 40s by now is common, the 30s are a few weeks away.
Voting:
Good: 16
Bad: 3
Tags: fall

Before the first 32
09 Sep 2008 06:37 AMThe featured chart is a temperature composite of the time period before and after the first sub 32 degree temperature in the fall from the Des Moines Airport. The three lines represent the temperature range and average of the observations 3 days before thru 1 day after the event. The 12 hours before the first event show a rapid cooling which is often the case with clear skies during the night time hours. Those clear skies are then typically around for the next day when temperatures quickly recover.
Voting:
Good: 23
Bad: 4
Tags: fall freeze