Automated Data Plotter
This application dynamically generates many types of graphs derived from various IEM data sources. Feel free to use these generated graphics in whatever way you wish.
1 Select a Chart Type
2 Configure Chart Options
Plot Description:
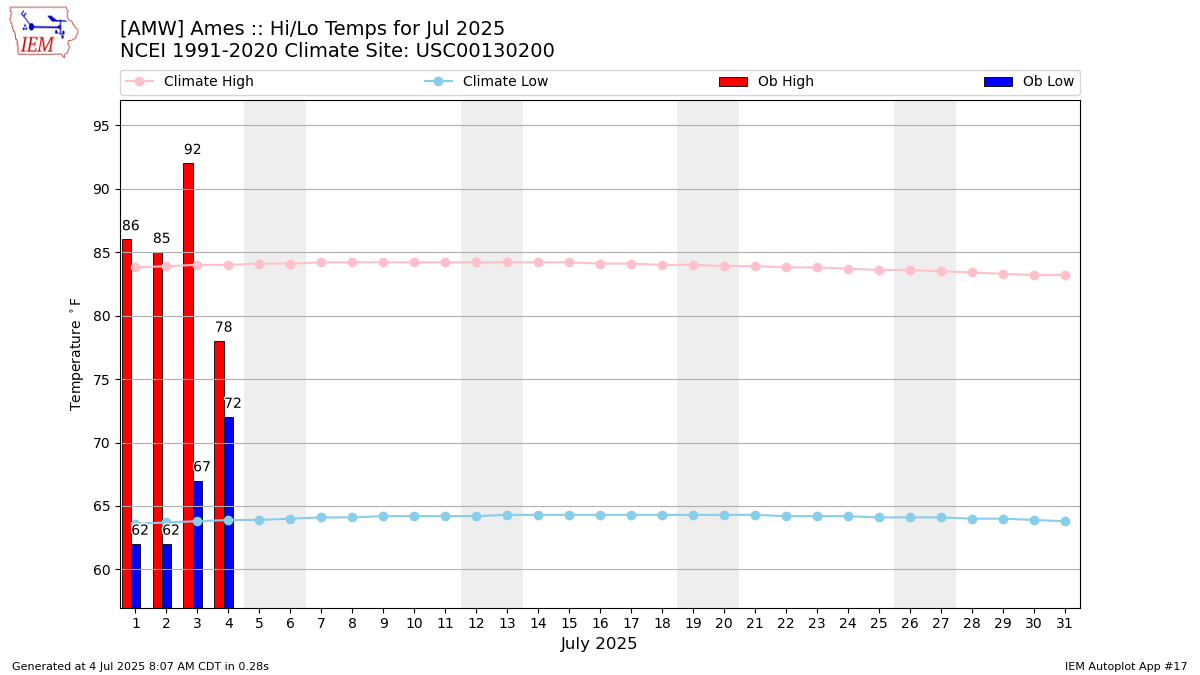
Daily plot of observed high and low temperatures or precipitation along with the daily climatology for the nearest (sometimes same) location. The vertical highlighted stripes on the plot are just the weekend dates.3 Generated Chart
Based on recent timings, plot generation averages 2 seconds. Please wait while your chart is being generated...
If you notice plotting issues with the image above, please
contact us
and provide the URL address currently shown by your web browser.
IEM Daily Features using this plot
The IEM Daily Features found on this website often utilize plots found on this application. Here is a listing of features referencing this plot type.