The Iowa Environmental Mesonet (IEM) collects environmental data from cooperating members with observing networks. The data are stored and made available on this website.


Increasing Runoff
Posted: 02 May 2024 05:30 AM, Views: 1208
Tags: usgs
The featured chart is courtesy of the USGS WaterWatch website (click toolkit, then state duration hydrograph). The chart shows an estimated statewide averaged runoff value with the y-axis having a logarithmic scale. The chart shows that recent rains have improved the surface hydrologic situation with runoff values somewhere closer to a average value and the largest since last June. Filling area water reservoirs and rivers are both important to many parts of Iowa's economy and providing drinking water to many municipalities. More rain is in the forecast and continued hopes for doing significant drought busting over the coming weeks.
Previous Years' Features
16 April NWS Data Outage [resolved]
Posted: 16 Apr 8:53 AM
15 April NWS Website Outage [resolved]
Posted: 15 Apr 9:54 PM
15 April GOES Outage [resolved]
Posted: 15 Apr 10:52 AM
3 April NWS Data Outage
Posted: 3 Apr 1:08 PM
2 April NWS Data Outage
Posted: 2 Apr 8:40 AM
Sign up for the Daily Bulletin
Soil Temperatures

Data from the Iowa State Soil Moisture Network is found on this website and daily soil temperature averages are used to produce the highlighted analysis.
Current Data
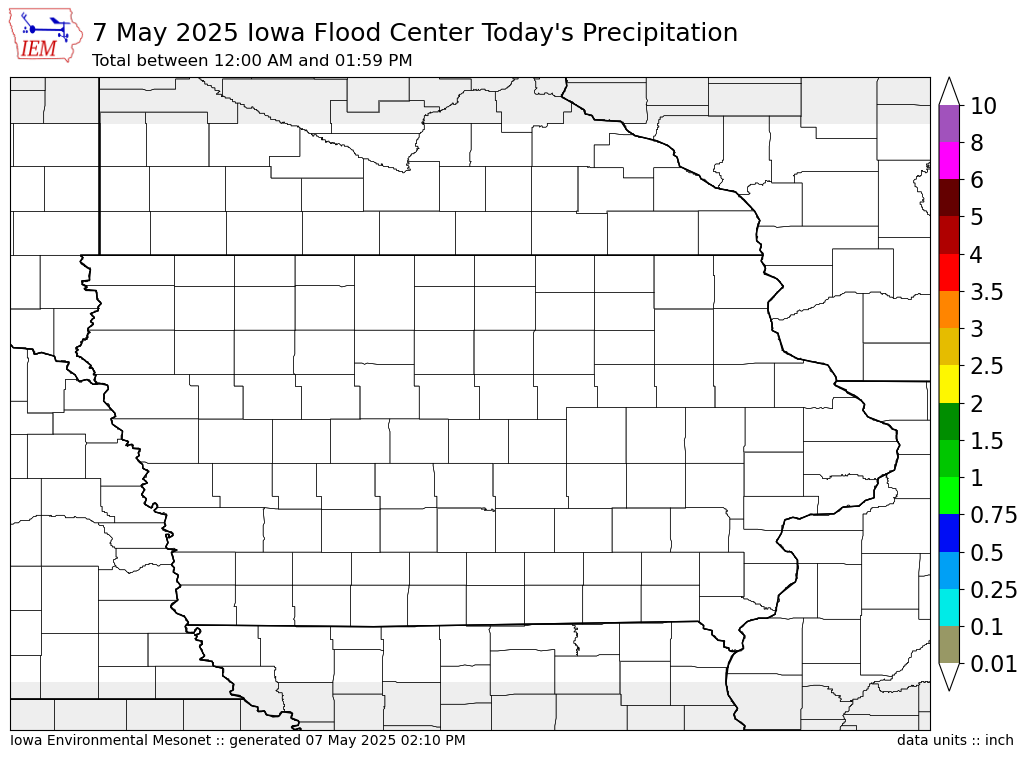
The IEM combines data from participating networks into products like maps shown above and web applications to analyze the data.
Partners: