Past IEM Features tagged: temperatures

Frequency below Freezing
12 Feb 2015 05:45 AMTemperatures will struggle today to reach the upper teens as a brisk reminder of the winter season arrives in Iowa. The featured chart looks at the hourly frequency of having a sub freezing temperature partitioned by week of the year. For mid February, having a sub freezing temperature is very common for the night time hours, but the afternoon hours are slightly less than 50%. The chart would indicate that we have at least one month of time to go before this type of weather becomes uncommon. You can generate this chart on the website for other sites and temperature thresholds of your choice.
Voting:
Good: 15
Bad: 7
Abstain: 5
Tags: temperatures

Daily Climate
16 Jan 2015 05:42 AMOur current rebound in temperatures to levels well above freezing are certainly a nice break from the recent few weeks of cold weather. Climatology says that the middle of January is the coldest time of the year, but climatology can be computed different ways. The featured chart presents three daily temperature climatology metrics. The National Climatic Data Center (NCDC) produces 30 year normals which are updated every ten years. The chart shows the most recent two iterations of that product as well as the simple daily average of long term observations. The 1971-2000 product was provided in whole degree Fahrenheit, so that is why it jumps up and down on the plot. It is interesting to note the difference between the 1981 product and the other two metrics.
Voting:
Good: 38
Bad: 10
Abstain: 13
Tags: daily temperatures

Temperature bins
14 Jan 2015 05:45 AMThe featured chart displays the frequency of having an air temperature within a given range for Des Moines based on long term hourly temperature records. For January, about 75% of the time is spent at temperatures below freezing. In July, we spent about 75% of the time at temperatures above 70. You can generate this plot on this website and pick the intervals you are interested in for the station of your choice.
Voting:
Good: 18
Bad: 6
Abstain: 3
Tags: temperatures
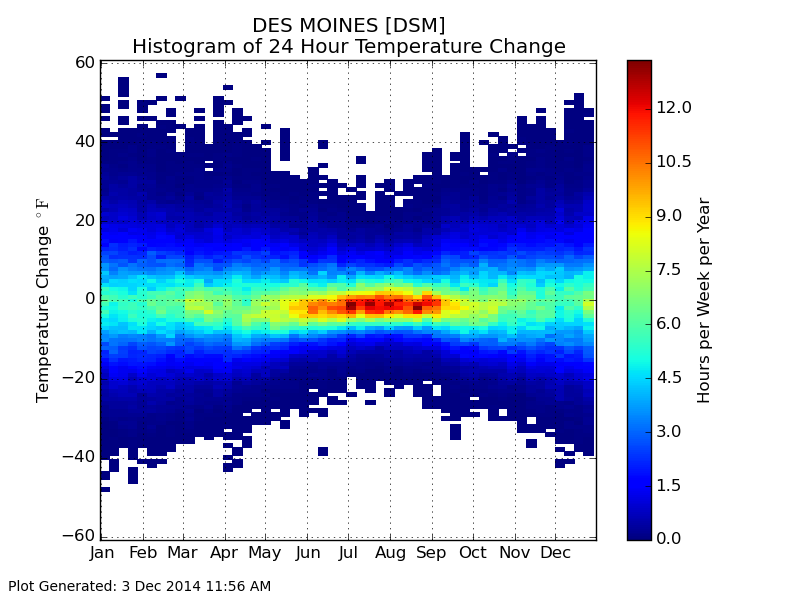
24 Hour Changes
03 Dec 2014 05:44 AMYesterday's feature presented the largest temperature drop over 24 hours for the most recent cold front passage. Today's featured chart presents a histogram of these changes for Des Moines over its period of record by week of the year. The area of peak frequencies is interesting in this plot. It exists for slightly negative numbers between June and October. This area represents slight day to day cooling with temperatures being the most common regime. Without solar input, our temperatures would cool each day, that is our baseline regime. Warm air masses and the sun fight this cooling each day, attempting to warm us up.
Voting:
Good: 14
Bad: 10
Abstain: 4
Tags: temperatures