Past IEM Features tagged: model

Throwing Darts
02 Feb 2017 05:34 AMThe National Center for Environmental Prediction (NCEP) runs a seasonal forecast model known as the Climate Forecast System (CFS). The IEM has been archiving the morning run made each day that goes out nine months into the future. The featured chart presents each model run's forecast for average February temperature for Ames. Within the meteorological community, the CFS model has been criticized for having poor run to run consistency and the featured chart illustrates that pretty clearly. The scatter plot shows forecasts all over the board with wild fluctuations between successive model runs. One would hope to more obvious trends with successive runs providing incremental changes as the model trends warmer or cooler. So what will our February look like? Perhaps throwing a dart would be as effective :)
Voting:
Good: 12
Bad: 0
Abstain: 1
Tags: cfs model

Missed Rainfall Forecast
25 Sep 2014 05:38 AMThe rain that fell over central Iowa on Wednesday was largely unforecasted by the main weather forecast models run in the US. The featured chart displays grid point output from the GFS model for Ames. This model is run four times per day and for this analysis produces a precipitation forecast at three hour intervals. The top row of data is actual observations from the Ames Airport and the grid below represents the forecasts made from each successive model run. Ames picked up over 0.6 inches with some very isolated values over an inch for Central Iowa. It is interesting to see an event missed like this and provides confirmation that there is still room for humans in the weather forecasting process!
Voting:
Good: 15
Bad: 6
Abstain: 3
Tags: model

Bad Forecast?
14 Nov 2013 05:37 AMA prominent meteorological forecast model, North American Mesoscale (NAM), run by the National Centers for Environmental Prediction produced what would appear to be a very bad forecast for near surface air temperature on Wednesday. The featured map shows the forecasted temperature bias for noon with many sites in the upper midwest around 10 degrees too cold. On the surface, this would appear to be a bad forecast, but there was a reason why the temperatures were too cold. The shaded areas on the map show analyzed snow depth that the model was provided to start the forecast. Of course, these snow depths are way off with much of Iowa shown in the 1-3 inch range, whereas reality was just a trace, if that. So the worst temperature predictions are shown over areas with incorrectly analyzed snow depth. This begs the academic question of if this was a bad forecast or an example of garbage in - garbage out?
Voting:
Good: 32
Bad: 2
Abstain: 4
Tags: model forecast

Model flip flop
28 Feb 2013 05:43 AMOur most recent snow storm caused great gnashing of teeth as some areas not expected to receive much snowfall got 8-12 inches! The featured chart attempts to explain why this surprise happened. The GFS forecast model is one of the models used by forecasters to predict the weather. The model is run four times daily and each run produces a forecast out the next week or so. The featured chart presents the model forecasted precipitation for a grid cell over the Des Moines Airport. The top bar displays what was observed. If you focus on the third column in the grid where the most intense precipitation fell, you will see that the model went from a dry solution for Des Moines to having a storm to then again dry and the runs made on the 26th ramped up the totals tremendously. These changes are due to storm track differences as the model moved the storm initially south of Des Moines and then brought it back.
Voting:
Good: 29
Bad: 4
Tags: model

Model Consistency
18 Feb 2013 05:43 AMThere is currently a lot of excitement over the upcoming winter storm forecasted for Thursday into Friday. The featured chart looks at forecasted precipitation totals for Des Moines from the GFS model. The chart shows the current storm along with six recent heavy snowfall events. Each bar represents one of the four model runs made per day prior to the event. The general lack of consistency creates a creditably issue for forecasters. The top series shows one model run dumping a huge amount of precipitation and then backing off on the total up until the event. The fifth and sixth chart show going from having no precip to a storm. The caveat not illustrated here is the storm track, by which small displacements can make a huge difference in forecasted precipitation for a fixed location.
Voting:
Good: 37
Bad: 3
Tags: model forecast

Rainfall forecasting
15 Jun 2012 05:35 AMThe featured chart presents a forecast model's prediction of 3 hourly precipitation accumulations for a grid cell over Des Moines. Each row represents a sequential model run and forecast out for eight days. The white cells represent a time period outside the bounds of the forecast temporal domain and pink cells represent a dry forecast. The columns represent the change in the forecast over time and you can see a lot of variability with the amount predicted. Some of the forecast runs dumped considerable rainfall today and into this weekend, while others are on the dry side. This model variability makes life fun for weather forecasters. What will actually happen?
Voting:
Good: 167
Bad: 44
Tags: model

View larger image
white color is no forecast (outside of model time bounds), pink is near zero or zero
Heavy snow, rain, or nothing?
03 Feb 2012 06:04 AMWinter is expected to return this weekend with a storm system developing just to our southwest this morning. The weather forecast models have been teasing a significant snowfall for Iowa, but change their mind after sequential runs in time. The featured chart presents Global Forecast System (GFS) model forecasted precipitation for a grid point near Des Moines. The model is run every six hours producing a forecast out for the next two weeks or so. Model runs up until January 30th had this weekend being dry. Subsequent model runs then dumped heavy amounts of rain or snow or some mixture for Des Moines. Two model runs yesterday had Des Moines missing almost all precipitation. The most recent run (top row) now has rain today and snow on Saturday. Model inconsistencies like this make life fun and the folks that forecast the weather for a living lose hair or grey quickly.
Voting:
Good: 21
Bad: 4
Tags: model
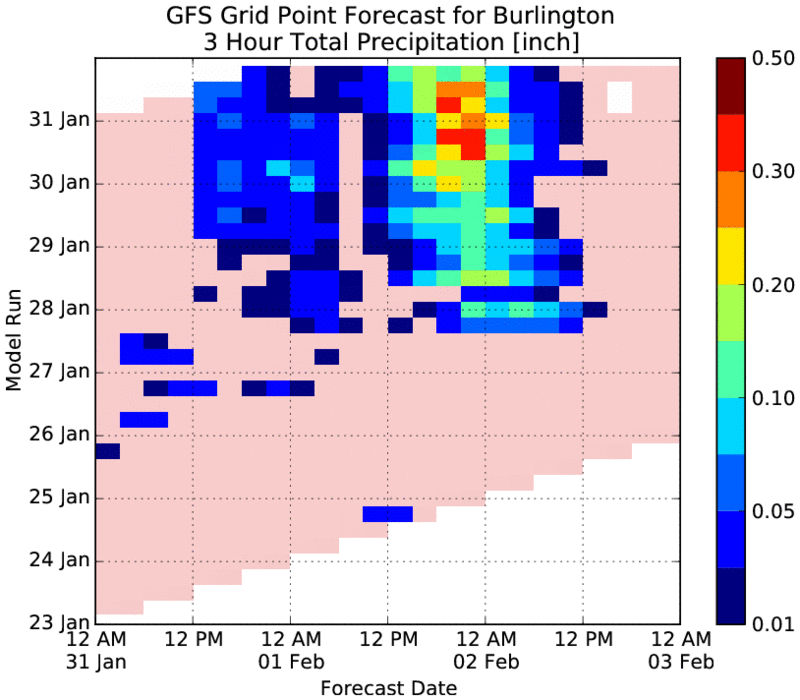
From nothing to a foot or more
01 Feb 2011 05:57 AMThe featured chart shows the time evolution of the GFS weather model forecast for precipitation for Burlington. The model runs made last week for today had no precipitation for Burlington, but the last three days worth of runs have advertised a significant snowfall event with totals over a foot expected. This is a part of one of the most hyped winter storms over the plains in recent memories. Blizzard warnings are posted for this afternoon as winds will be picking up and blowing whatever does fall around creating a huge mess. Iowa should miss out on the major ice accumulations expected to fall over Missouri and Illinois.
Voting:
Good: 44
Bad: 4
Tags: model

Evolution of the forecast
23 Dec 2010 05:57 AMThe GFS weather forecast model is run by the US government and produces forecasts from the current time out to about two weeks into the future. The model runs for the past week have been advertising a snow storm for today into Christmas Eve. This forecast has evolved over time though as is presented by the featured chart. Each row in the chart represents a successive forecast model run. The area in white is outside the time domain of the given model's run output data (8 days). Model runs made on the 19th dumped a fair amount of snow on Ames for today, but have since backed off on the amounts and delayed the onset by 12 or more hours. Making sense of this changing forecast is one of the reasons why we still have humans diligently creating forecasts each day.
Voting:
Good: 49
Bad: 12
Tags: model

Loading up with water
22 Jul 2010 06:14 AMThe featured chart displays a forecast model's initial analysis along with the latest forecast of precipitable water approximately for Ames. This value can be considered the depth of water in the atmosphere if all of it was squeezed out. When values exceed two inches, slow moving thunderstorms are able to quickly dump lots of rain. The heaviest rains this morning are just north of Ames with a report of 5 inches already around Fort Dodge.
Voting:
Good: 28
Bad: 6
Tags: model

Scary Models
21 Jul 2010 06:54 AMThe featured map is forecasted precipitation from the NAM weather forecast model from a run yesterday afternoon showing Iowa getting a tremendous amount of rainfall through Thursday afternoon (over 10 inches is the highest amount). These forecast models are run multiple times per day and the latest runs have moved this precipitation bullseye around a lot. Regardless, extremely heavy rainfall is set to fall somewhere in the midwest.
Voting:
Good: 28
Bad: 5
Tags: model

10,000+ CAPE
15 Jul 2010 07:09 AMThe featured map displays the RUC computer weather model forecast of surface based CAPE for yesterday afternoon. CAPE is a measure of the vertical accelerations possible if air is forced upward initially. Typically, values of around 3,000 indicate severe storms are possible. Due to the extreme surface temperatures and dew points yesterday, values were over 10,000 J/Kg. Values this large are extremely rare.
Voting:
Good: 35
Bad: 10
Tags: cape model