Past IEM Features tagged: june

Cold June Morning
13 Jun 2023 05:30 AMOur recent stretch of rather weird weather continued on Monday with low temperatures dropping into the 40s and even 30s over eastern Iowa. A NWS COOP site near Elkader (far NE Iowa) reported a low of 35 degrees and the observed denoted frost present! The featured map presents low temperature reports on Monday and the year one has to go back to find as cold of a low temperature during the month of June. Temperatures over eastern Iowa were certainly exceptional with the blue locations having to go back at least 20 years to find as cold of a temperature.
Voting:
Good: 11
Bad: 0
Tags: june 2023

Des Moines Left Out
25 Jun 2014 05:37 AMThe significant rainfalls this June have mostly missed central Iowa leaving quite the disparity between the total precipitation for Des Moines versus other locations in the state. The featured chart compares the average precipitation for four cities in Iowa vs the Des Moines Airport total. This June appears far away from the 1to1 line and unlike anything we have seen since 1951. There is still days left this June, so perhaps the difference will be made up with further storms expected.
Voting:
Good: 19
Bad: 7
Abstain: 9
Tags: jun14 june

Winds from the gulf
11 Jun 2012 05:39 AMThe world's oceans are a major source of water vapor in our atmosphere which leads to precipitation over land. Being well inland within a continent, Iowa's main source of moisture in our atmosphere comes to us thanks to Gulf of Mexico. By looking at prevalent wind directions for observation sites near the coast like Beaumont, Texas, we can get an approximation of how much of the surface air flow is coming inland off of the ocean water. The featured chart presents the frequency of having on-shore flow at this point in Texas against the precipitation total for the month of June here in Iowa. The implication is that by having more on-shore flow, our moisture supply will increase and lead to more precipitation in Iowa. The chart mostly verifies this, but our precipitation is not as simple as looking at wind flows off of the gulf. Certainly, this metric provides some insight into the atmospheric circulation regime that may help to enhance our precipitation. The value so far this June is presented and would somewhat support the notion that our flow of moisture off the gulf has been limited somewhat this year.
Voting:
Good: 74
Bad: 14
Tags: gulf june texas

Plenty of rainy days
01 Jul 2010 06:11 AMJune is finally in the books! Des Moines had 22 days with measurable precipitation which ties a record set back in 1902. Even with all those rainy days, we ended June on a very dry note with day four of no-rain in progress today. Friday should be dry as well with rain holding off until the holiday weekend. Hurricane Alex looks to impact our weather on Sunday and possibly bring more heavy rainfall.
Voting:
Good: 20
Bad: 2
Tags: jun10 june
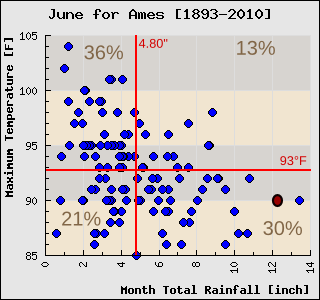
June max temp and rainfall
30 Jun 2010 05:09 AMThe featured chart plots the relationship between the total rainfall during June with maximum temperature observed based on data from Ames. The red lines indicate the average value and the percentages show the frequency of the observations in each quadrant. Having both above average rainfall and maximum temperature is the least common combination, which makes physical sense as typically the warmest temperatures are associated with dry soils, which implies less precipitation. The 2010 value is shown with the red dot.
Voting:
Good: 23
Bad: 3
Tags: june

Winds and Rain
16 Jun 2009 06:10 AMThe featured image is an attempt to show how the wind changes direction when it rains. While there appears to be no obvious signal in this chart, it is interesting to note the clustering of points around south to southeast. Of course, if we are seeing southwest around to northeast winds, rain is probably not in the immediate forecast.
Voting:
Good: 12
Bad: 5
Tags: june

Lacking moisture and southerly winds
28 Jun 2006 12:21 AMThe table presented here provides an interesting comparison of winds, rainfall, and dew points for the past 7 Junes for Ames. The first noticable value is the average 4 PM dew point of only 54 degrees with all other years in the upper 50s and 60s. Certainly not having much rain is involved in our low dew points due to decreased evaporation, but perhaps the most important factor is the lack of southerly winds shown by the very low value of v-component wind. The v wind is simply the component of the wind from the north or south. A larger value of v indicates a stronger southerly wind and thus greater moisture transport from the more humid air masses to our south. You can see the largest v values associated with very humid June months of 2005 and 2002.
Voting:
Good: 13
Bad: 12
Tags: june