Precip Reliabillity
Posted:
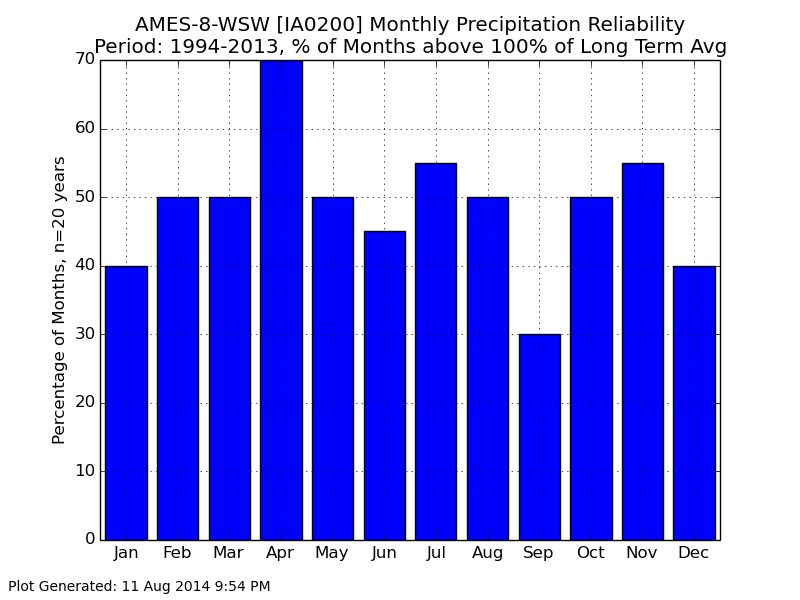
After yet another recent wet spring, the later part of summer has turned dry again. The
featured chart looks at the recent 20 years of monthly precipitation reliability. The metric
plotted is the number of years that the given month had above 100% of average
precipitation for the month. These values are for Ames. Rewording, 70% of the past 20
years had above average precipitation for April. So while April is shown with the highest
value, September has the lowest at just 30%. This chart can be dynamically generated on
the website, so please try different thresholds and periods to see what results you get!
Voting:
Good = 16
Bad = 6
Abstain = 9
Tags: precip
Voting:
Good = 16
Bad = 6
Abstain = 9
Tags: precip