Below average lows
Posted:
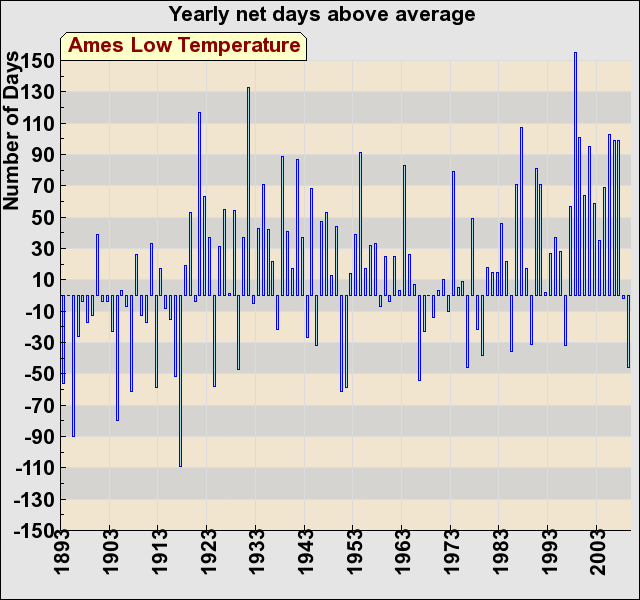
The featured chart displays the yearly net total of days above average for low temperature (negative values would mean that more days were below average than above). So far in 2009, Ames has seen 50 more days below average for low temperature. This is roughly the largest negative value we have seen in the last 40 years, granted there are 2.5 months left to this year yet.
Voting:
Good = 34
Bad = 15
Tags: lows
Voting:
Good = 34
Bad = 15
Tags: lows
