Automated Data Plotter
This application dynamically generates many types of graphs derived from various IEM data sources. Feel free to use these generated graphics in whatever way you wish.
1 Select a Chart Type
2 Configure Chart Options
Plot Description:
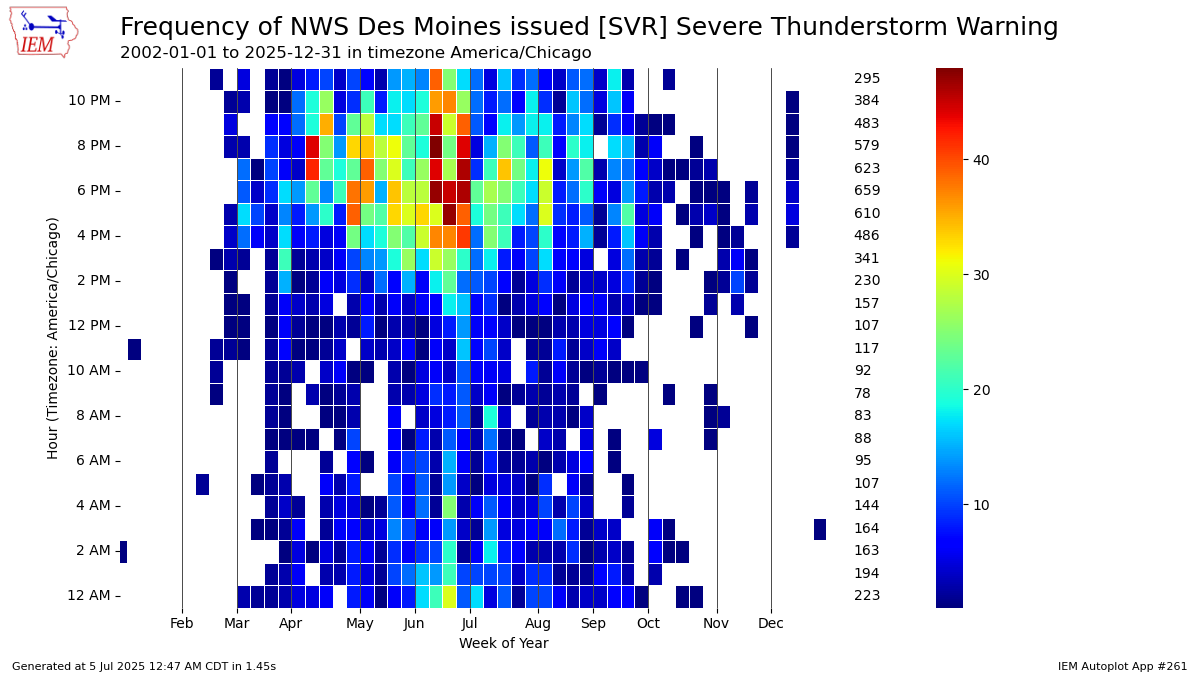
This chart presents a heatmap of the issuance hour of a given NWS Text Product. While data does exist back into the 1980s, the archive quality and numerous changes with various products make long term plots a bit problematic. Please do not conflate this plot to represent when the given products are active. For example, a Flash Flood Watch issued at 9 AM and valid for a period from 3 PM till 3 PM the next day will only count as one at 9 AM. If you want statistics on when various alerts are active, try Autoplot 48.3 Generated Chart
Based on recent timings, plot generation averages 3 seconds. Please wait while your chart is being generated...
If you notice plotting issues with the image above, please
contact us
and provide the URL address currently shown by your web browser.
IEM Daily Features using this plot
The IEM Daily Features found on this website often utilize plots found on this application. Here is a listing of features referencing this plot type.
- 25 Jun 2025: Flash Flood Warning Issuance