This application dynamically generates many
types of graphs derived from various IEM data sources.
Feel free to use these generated graphics in whatever way
you wish.
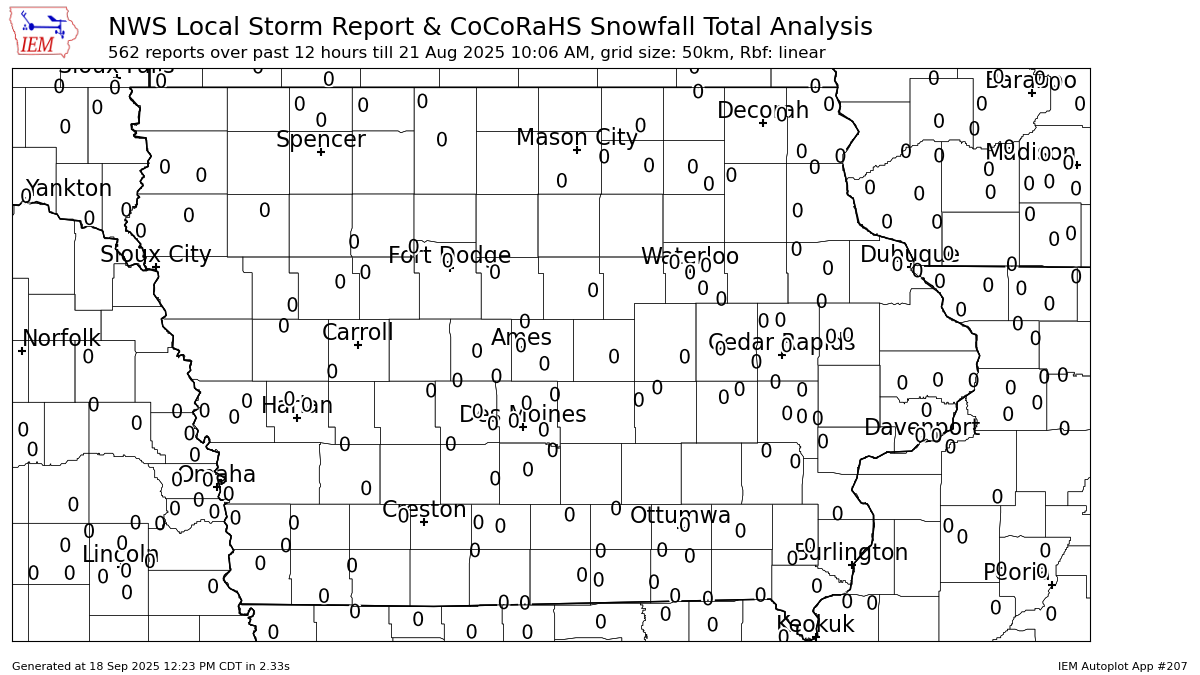
Generates an analysis map of rainfall, snowfall, or freezing rain data
based on NWS Local Storm Reports, NWS COOP Data, and CoCoRaHS. This autoplot
presents a number of tunables including:
The window of hours to look before the specified valid time to
find Local Storm Reports (LSR).
The option to attempt to inject zeros into the observations prior
to doing an analysis. Since the LSRs are all non-zero values, sometimes
it is good to attempt to add zeros in to keep the reports from bleeding
into areas that did not receive snow.
You can pick which
SciPy.interpolate.Rbf
function to use. The radius in the function shown equals the grid cell
size used for the analysis.
You can optionally include any NWS COOP reports that were processed
by the IEM over the time period that you specified.
If you download the data for this analysis, there is a column
called {USEME} which denotes if the report was used to
create the grid analysis. There is a primative quality control routine
that attempts to omit too low of reports.
Having trouble with this app? If so, please copy/paste the URL
showing the bad image and email it to us!
3
Generated Chart
Based on recent timings, plot generation
averages 5 seconds. Please wait while your
chart is being generated...