Automated Data Plotter
This application dynamically generates many types of graphs derived from various IEM data sources. Feel free to use these generated graphics in whatever way you wish.
1 Select a Chart Type
2 Configure Chart Options
Plot Description:
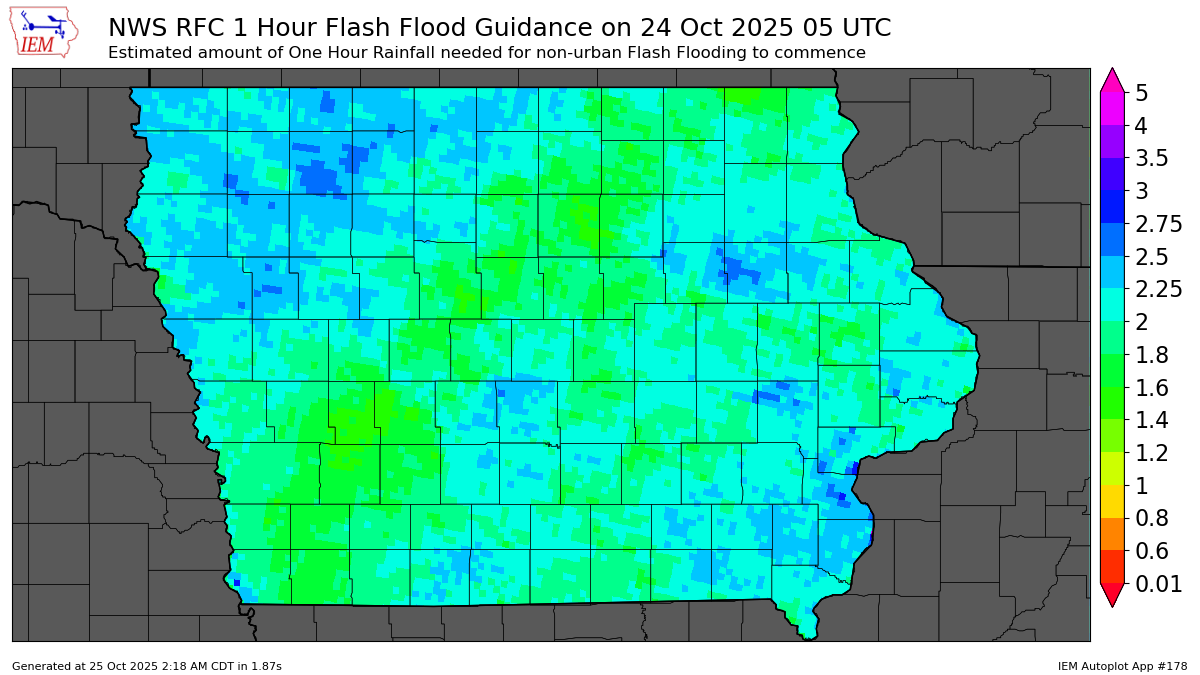
This application plots Flash Flood Guidance for a time of your choice. The time is used to query a 24 hour trailing window to find the most recent FFG issuance.For dates after 1 Jan 2019, a gridded 5km analysis product is used as the county guidance was discontinued. The raw data download option does not work for that data either. You can find the raw Grib files on the IEM Archives, for example here.
Additionally, there is a FFG by Point web service that provides the raw values.
For dates before 1 Jan 2019, this dataset is based on IEM processing of county/zone based FFG guidance found in the FFG text products.
3 Generated Chart
Based on recent timings, plot generation averages 4 seconds. Please wait while your chart is being generated...
IEM Daily Features using this plot
The IEM Daily Features found on this website often utilize plots found on this application. Here is a listing of features referencing this plot type.
- 04 Jul 2024: Three Hour FFG
- 25 Jul 2022: Three Hour Flash Flood Guidance
- 30 Sep 2019: Low Flash Flood Guidance
- 30 Mar 2018: One Hour Flash Flood Guidance
- 18 Apr 2017: Flash Flood Guidance
- 09 Apr 2008: Low FFG
- 18 May 2005: Flood Guidance