Automated Data Plotter
This application dynamically generates many types of graphs derived from various IEM data sources. Feel free to use these generated graphics in whatever way you wish.
1 Select a Chart Type
2 Configure Chart Options
Plot Description:
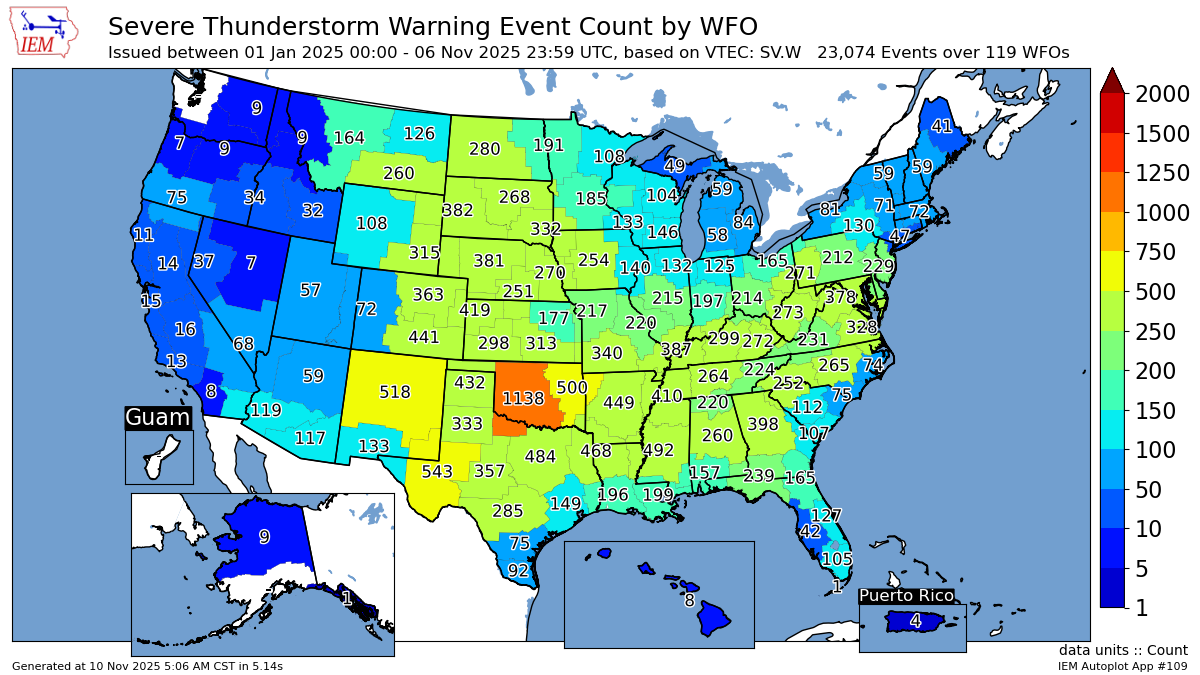
This application generates per WFO or state maps of VTEC event counts. The current three available metrics are:- Event Count: The number of distinct VTEC events. A distinct event is simply the usage of one VTEC event identifier.
- Days with 1+ Events: This is the number of days within the period of interest that had at least one VTEC event. A day is defined within the US Central Time Zone. If one event crosses midnight, this would count as two days.
- Percent of Time: This is the temporal coverage percentage within the period of interest. Rewording, what percentage of the time was at least one event active.
- Rank of Event Count: The ranking from least to greatest of the given period's event count vs period of record climatology.
- Departure from Average of Event Count: The number of events that the given period differs from the period of record climatology.
- Mean of Event Count: The average number of events for the given period.
- Standardized Departure from Average of Event Count: The departure expressed in sigma units of this periods event total vs the period of record climatology.
PLEASE USE CAUTION with the departure from average plots as they are not exactly straight forward to compute. If you are plotting small periods of time, individual events will heavily skew the averages. The exact start date of each event type is not an exact science due to the implementation of some products and other complexities. For Severe Thunderstorm, Tornado, Flash Flood, and Marine Warnings, the IEM has a special accounting of these back to 2002. For other event types, the archive starts with the VTEC implementation, which varies by product.
Note that various VTEC events have differenting start periods of record. Most products go back to October 2005.
3 Generated Chart
Based on recent timings, plot generation averages 5 seconds. Please wait while your chart is being generated...
IEM Daily Features using this plot
The IEM Daily Features found on this website often utilize plots found on this application. Here is a listing of features referencing this plot type.
- 10 Jun 2025: SVR Count Ranks
- 06 Nov 2024: Another Blue/Red Map
- 07 Jul 2023: SVR Warning YTD Ranks
- 26 May 2023: SVR + TOR Warning Ranks
- 20 May 2022: Severe Warning Departures
- 15 Sep 2021: Severe Departure
- 14 May 2021: Dearth of Severe Weather
- 14 Jan 2021: High Wind Warning Counts
- 20 Jun 2019: Flood Warning Days
- 01 Oct 2018: Summer of Flooding
- 10 Jan 2018: Winter Storm Warning Counts
- 06 Apr 2016: Severe TStorm Counts
- 15 Jun 2011: 2011 Tornado Warning Counts