Past Features
This page lists out the IEM Daily Features for a month at a time. Features have been posted on most days since February 2002. List all feature titles.
Fri Jul 01, 2022
D3 Drought Returns
01 Jul 2022 05:30 AM
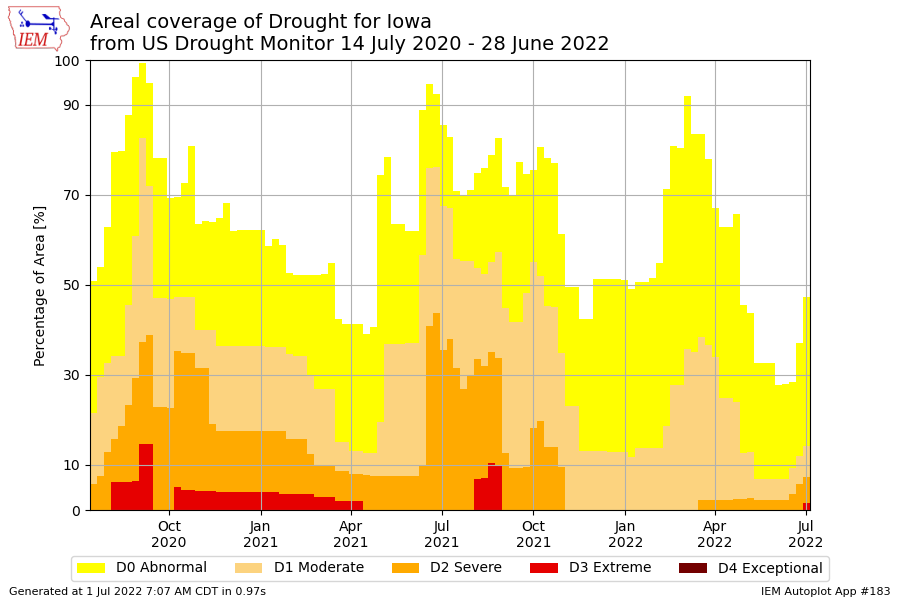
The weekly US Drought Monitor update was released on Thursday and had a tiny portion of northwestern Iowa in D3 "Extreme" classification. The featured plot presents a weekly time series of the areal percentage of Iowa within a given drought classification. The D3 introduction last summer was somewhat short lived, so hopefully such can be the case again this year. The overall coverage for the state is still below 50%, but the calendar now says July and heat stress along with dry weather become ever more common for Iowa.
Voting: Good - 13 Bad - 0
Generate This Chart on Website
01 Jul 2022 05:30 AM
The weekly US Drought Monitor update was released on Thursday and had a tiny portion of northwestern Iowa in D3 "Extreme" classification. The featured plot presents a weekly time series of the areal percentage of Iowa within a given drought classification. The D3 introduction last summer was somewhat short lived, so hopefully such can be the case again this year. The overall coverage for the state is still below 50%, but the calendar now says July and heat stress along with dry weather become ever more common for Iowa.
Voting: Good - 13 Bad - 0
Generate This Chart on Website
Mon Jul 04, 2022

Hot 4th
04 Jul 2022 05:30 AM
Temperature and humidity levels are expected to be elevated for your fourth of July along with chances of thunderstorms. The NWS has a Heat Advisory in effect for portions of the state. The featured chart presents the high temperature for Des Moines for each July 4th. With highs expected in the lower 90s, it will be a bit above average and on the hot end of what can be expected for this date of the year. The recent 100 degree high happened back in 2012. Any chances for 100 degree temperatures this year will be isolated to far western Iowa.
Voting: Good - 8 Bad - 0
Generate This Chart on Website
Tue Jul 05, 2022

Drought Evaluation Time
05 Jul 2022 05:32 AM
The weekly US Drought Monitor considers the past seven days of precipitation up until Tuesday morning to produce an updated analysis released on Thursday morning. So the featured map presents the combination of the past seven days MRMS estimated precipitation departures from average along with the Drought Monitor from last week. Of course, one map does not tell the complete story in the process of updating the analyzed drought, but this map at least indicates areas that have the potential for improvements or degradation. The big rains on July 4th mostly missed far southern Iowa and this area continues to be trending dry. Clayton County (far NE Iowa) got some significant rainfall last night and maybe could see some improvements. Rainfall patterns are often complex and at a finer spatial scale than what attempts to be captured by the drought monitor.
Voting: Good - 18 Bad - 0
Generate This Chart on Website
Wed Jul 06, 2022

Emerged Soybeans
06 Jul 2022 05:30 AM
The weekly update to the USDA NASS crop progress estimates 99% of the soybean crop in Iowa now emerged. The featured chart presents the yearly time series of this metric with weekly values linearly interpolated down to daily steps. The 99% value is denoted with an X each year. The chilly spring and late start to planting has put the soybean crop a bit behind schedule, but recent warmth and rainfall has helped the overall condition of the crop.
Voting: Good - 11 Bad - 1
Generate This Chart on Website
Thu Jul 07, 2022
Day to Day Low Change
07 Jul 2022 05:30 AM
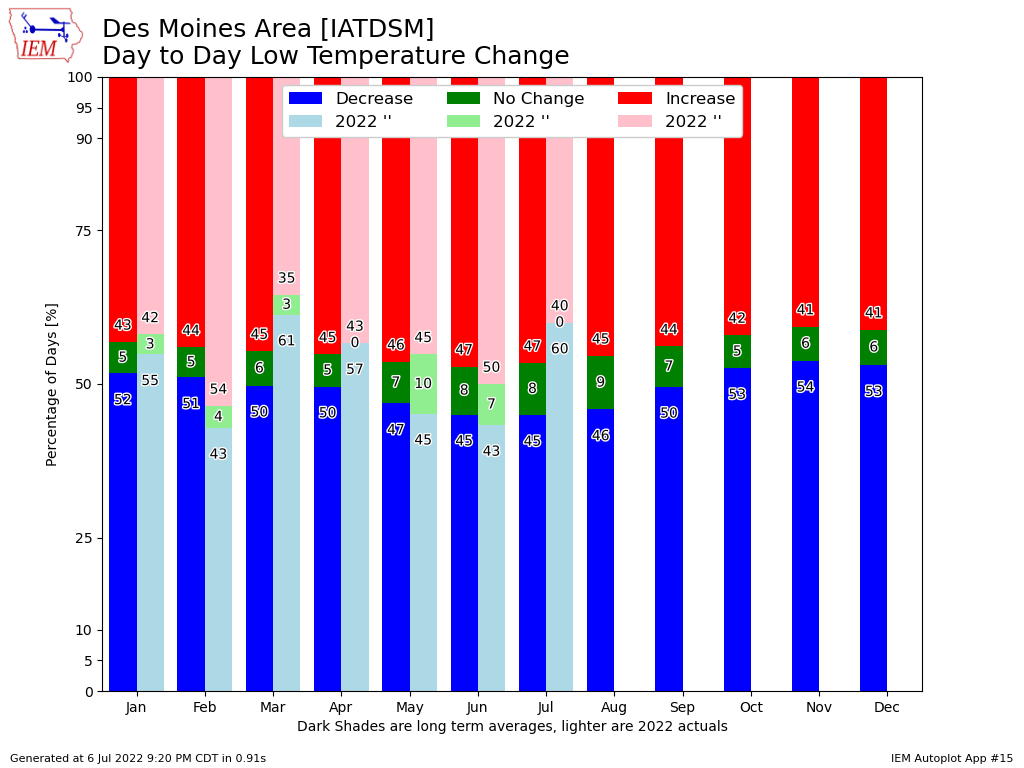
After a very warm Tuesday, temperatures were cooler on Wednesday. The day to day change in temperature is the subject of today's featured chart. The chart presents the frequency of the day to day change in daily low temperature increasing, decreasing, or staying the same. The long term climatology is shown along with 2022 observations. While the magnitude is small, there is a clear annual cycle shown with increasing frequencies of having warmer lows up until July and then decreasing after that. The cycle is a clear impact of climatology, which favors warming during day to day increases in daylight and cooling with day to day increases in night time. Again while the magnitudes are small, it is interesting to see the increase in frequency of having no temperature change during the summer months. This is explained by the decreased range in possible temperatures due to increased humidity levels and non-linearity with the integer Fahrenheit scale we use. The forecast for the rest of the week has decreasing daily low temperatures depicted, so it may be fun to check back in on this plot early next week and see how lopsided the 2022 July total is so far for the month.
Voting: Good - 7 Bad - 0
Generate This Chart on Website
07 Jul 2022 05:30 AM
After a very warm Tuesday, temperatures were cooler on Wednesday. The day to day change in temperature is the subject of today's featured chart. The chart presents the frequency of the day to day change in daily low temperature increasing, decreasing, or staying the same. The long term climatology is shown along with 2022 observations. While the magnitude is small, there is a clear annual cycle shown with increasing frequencies of having warmer lows up until July and then decreasing after that. The cycle is a clear impact of climatology, which favors warming during day to day increases in daylight and cooling with day to day increases in night time. Again while the magnitudes are small, it is interesting to see the increase in frequency of having no temperature change during the summer months. This is explained by the decreased range in possible temperatures due to increased humidity levels and non-linearity with the integer Fahrenheit scale we use. The forecast for the rest of the week has decreasing daily low temperatures depicted, so it may be fun to check back in on this plot early next week and see how lopsided the 2022 July total is so far for the month.
Voting: Good - 7 Bad - 0
Generate This Chart on Website
Fri Jul 08, 2022

Low Range for July
08 Jul 2022 05:30 AM
With a low temperature of 72 and a high of 80, there was only an eight degree temperature range for Burlington on Thursday. The featured chart presents some metrics on daily high and low temperatures for the site during July along with the associated ranges. The eight degree difference is shown with a percentile around 1, which implies a return interval of about once every 3 years. The small temperature difference during the day was thanks to high humidity levels, thick clouds for much of the day, and periods of rainfall. The atmosphere was loaded with moisture and while storms looked meager on RADAR, they were extremely efficient at rainfall production. Such is often the case this time of year as the lower atmosphere reaches peak warmth and upper level winds slacken, which leads to slower storm motion and heavier rainfall totals.
Voting: Good - 15 Bad - 0
Generate This Chart on Website
Mon Jul 11, 2022
Moisture Change
11 Jul 2022 05:30 AM
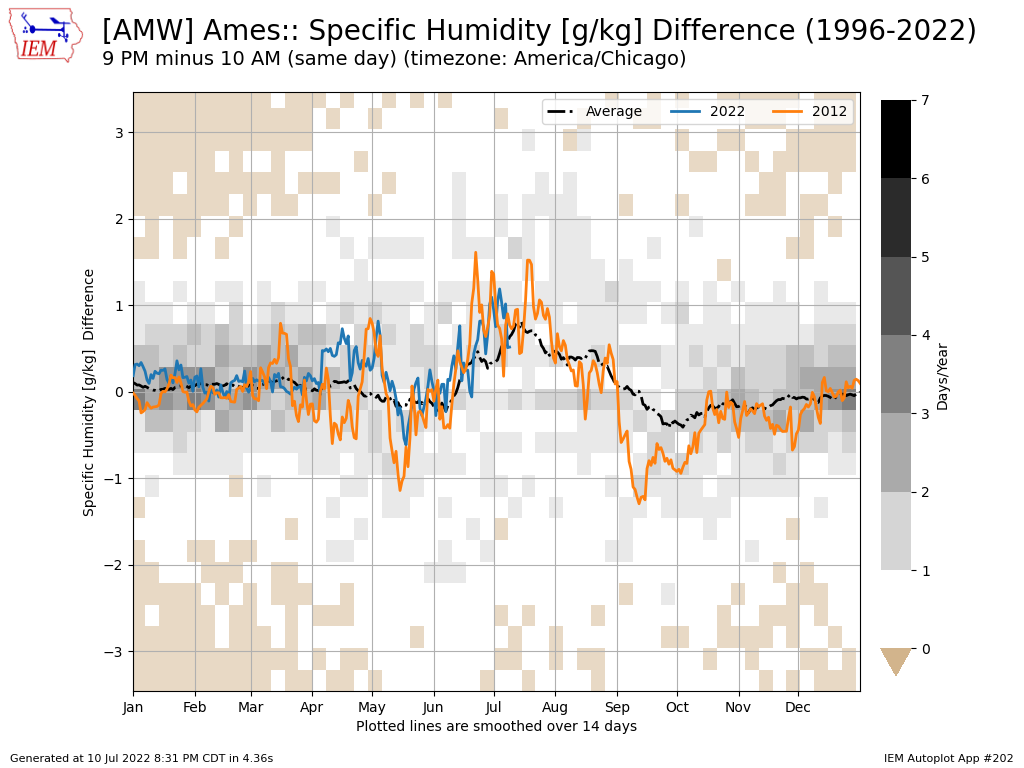
Some call it corn sweat, others use fancier terms like evapotranspiration. The net effect is the same, adding discomfort to summer time days in Iowa by increasing lower atmospheric humidity levels. The featured chart is a bit of a deep dive into teasing out what the magnitude of this effect is. The grid found on the chart presents a two dimensional histogram of daily change in specific humidity (mass ratio of water vapor to air) between 10 AM and 9 PM. Positive values indicate an increase in moisture. The lines present smoothed means for climatology, this year and the drought year of 2012. The annual cycle is very clear and the impact of crop transpiration is readily apparent as well. The peak in mid July is a sweet spot for corn activity and best frequencies of having ample available soil moisture. Crop senescence typical by the first week of September nicely coincides with the climatology turning negative as the drying effect of the fall season shows up until this start to become a wash later in November.
Voting: Good - 9 Bad - 1
Generate This Chart on Website
11 Jul 2022 05:30 AM
Some call it corn sweat, others use fancier terms like evapotranspiration. The net effect is the same, adding discomfort to summer time days in Iowa by increasing lower atmospheric humidity levels. The featured chart is a bit of a deep dive into teasing out what the magnitude of this effect is. The grid found on the chart presents a two dimensional histogram of daily change in specific humidity (mass ratio of water vapor to air) between 10 AM and 9 PM. Positive values indicate an increase in moisture. The lines present smoothed means for climatology, this year and the drought year of 2012. The annual cycle is very clear and the impact of crop transpiration is readily apparent as well. The peak in mid July is a sweet spot for corn activity and best frequencies of having ample available soil moisture. Crop senescence typical by the first week of September nicely coincides with the climatology turning negative as the drying effect of the fall season shows up until this start to become a wash later in November.
Voting: Good - 9 Bad - 1
Generate This Chart on Website
Tue Jul 12, 2022

Lightning Counts
12 Jul 2022 05:30 AM
Strong thunderstorms rolled through the state early Monday morning with damaging winds. One way to visualize the path is to create a heat map of lightning flashes as shown by the featured map. The map presents data courtesy of the National Lightning Detection Network with just over 33,000 lightning flashes logged between Sunday evening and noon on Monday. Each pixel in the grid display represents a 2 kilometer a-side square box with the colors representing the number of flashes counted within each box according to NLDN.
Voting: Good - 14 Bad - 2
Generate This Chart on Website
Wed Jul 13, 2022

Precip Bin Frequency
13 Jul 2022 05:30 AM
Today's featured chart takes a look at frequency of daily rainfall events by precipitation bin and week of the year for Des Moines. The bins are arbitrarily chosen and frequencies are relative to the total events for that given week. The warm season of the year is clearly the favored time for the heaviest rainfall events as a warmer atmosphere is able to hold more water vapor and thus support heavier amounts of precipitation. It is interesting to see more heavy precip events, in a relative sense, show up in October vs April. This is likely again due to overall atmospheric temperatures being warmer during October than April.
Voting: Good - 10 Bad - 0
Generate This Chart on Website
Thu Jul 14, 2022

Sioux City Streak
14 Jul 2022 05:09 AM
The featured map presents the current streak of number of consecutive days with a high temperature above (red) or below (blue negative numbers) average based on NWS climate reporting stations. Sioux City (SUX abbreviation) has a current streak of 17 straight days with a high temperature above average. It has been one of the driest areas of the state so far this year, so such dryness helps to boost daytime temperatures as the sun's energy is able to more efficiently heat the ground and thus the lower atmosphere. The streak is currently forecast to last at least another 7-10 days, so we'll keep watching to see how long it can last!
Voting: Good - 10 Bad - 0
Generate This Chart on Website
Fri Jul 15, 2022

July Clouds and Visibilities
15 Jul 2022 05:37 AM
The featured chart presents the hourly cloud and visibility reports for this July from Des Moines. The top panel attempts to replicate the sky condition by showing reported clear skies as blue and increasingly darker colors with lower and higher coverage cloud amounts. The skinny panel shows the horizontal visibility amount. The gloomy days just over a week ago are readily apparent along with the periods without reported clouds. Automated station reports of clouds are fraught with caveats including limits on how high up the sensor can "see" clouds. The forecast has a mix of clouds and sunshine for the weekend and then sunny/hot conditions for next week.
Voting: Good - 10 Bad - 1
Generate This Chart on Website
Mon Jul 18, 2022

Dust Bowl Highs
18 Jul 2022 05:41 AM
One of the first breathless rebuttals to climate change is to point out how the high temperatures during the Dust Bowl years of the 1930s were higher than they are today. Today's featured chart takes a deeper look into that by comparing the distribution of high temperatures for Des Moines. The most recent ten years are compared with the 1930s. The top panel shows a smoothed density estimate (histogram) for the two periods and the bottom panel plots the difference between the two. So while yes, the 1930s featured more days with very hot high temperatures, our present climate has more days with temperatures in the 80s. A first pass explanation is the increase in humidity which tends to prevent really hot temperatures during the summer time. Also of interest, check out the mean temperature for each period. Even with fewer very hot days, the mean temperature is fractionally higher than it was during the 1930s.
Voting: Good - 6 Bad - 3
Generate This Chart on Website
Tue Jul 19, 2022

Six Days of 90+
19 Jul 2022 05:30 AM
The climatologically warmest week of the year looks not to disappoint this week with Des Moines reaching 91 on Monday and forecast to hit 90 plus through Saturday. The featured chart presents the frequency of a given day of the year having the next five days (inclusive six days) with a high temperature of at least 90 degrees. Sure enough, the peak frequency is about this time of year. Typically these streaks are hard to maintain as summer time thunderstorm activity tends to knock down temperatures for one of the days with cloud cover or actual rainfall, so it remains to be seen if we can make it through Saturday as there are chances of rain in the forecast for this period.
Voting: Good - 11 Bad - 0
Tags: 90
Generate This Chart on Website
Wed Jul 20, 2022

July Highs Above Average
20 Jul 2022 05:30 AM
This week continues to live up to being the climatologically warmest on the year with high temperatures on Tuesday in the upper 80s and 90s. While we have had some warm days this July, overall it has not been all that bad so far. The featured chart presents the percentage of days each July with a daily high temperature above period of record average for an areal averaged statewide value. The overall average of 50.0% is shown and at first may seem like a no-brainer value, but the distribution of is not always "normal". Anyway, as do many other charts for July, the Dust Bowl era of the 1930s stick out including a few years with every day above average. You may notice the one 0% percent value, that occurred during July of 2009 with each day below average. So the 2022 value is still well below 50%, but there are a number of days left yet for the month and the forecast mostly continues the summer time heat into next week.
Voting: Good - 9 Bad - 0
Generate This Chart on Website
Thu Jul 21, 2022

Hot Hours Departure
21 Jul 2022 05:30 AM
While temperatures warmed again into the upper 80s and 90s on Wedneday, humidity levels were not all that bad and so it certainly was not as miserable as it could have been. The ugliness of summer time has generally stayed off to our south as shown by the featured map presenting an IEM calculation of the departure of number of hours this year with a heat index of at least 100 degrees vs a 50 year average for stations with data dating back that far. Places marked with an 'X' have a 2022 value above any previous year since at least 1973. The map nicely shows that the anomalously worse weather has mostly stayed just to our south this summer, but there is still plenty of summer left for Iowa to catch up.
Voting: Good - 12 Bad - 0
Fri Jul 22, 2022
Dog Days of Summer
22 Jul 2022 05:30 AM
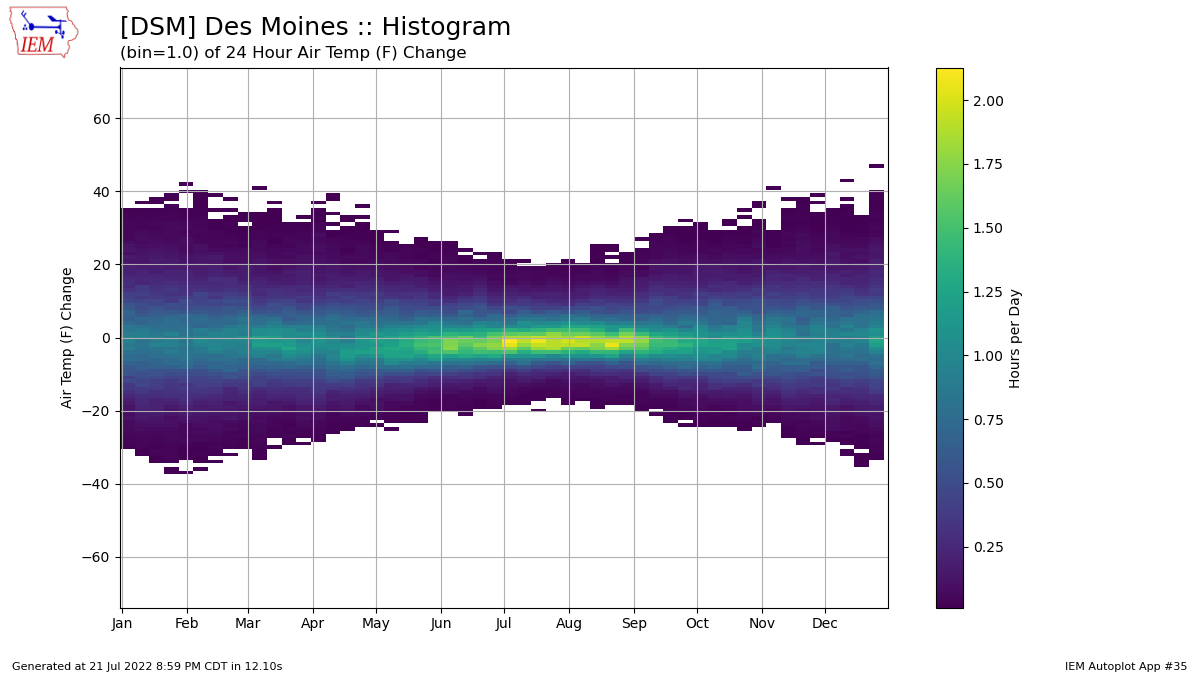
The "Dog Days of Summer" is an interesting term that folks tend to classify the summer weather as, but it actually applies to the juxtaposition of the Sun and Sirius. Anyway, the analog to weather typically relates to it being too hot for even a dog or things are hot and lazy as a dog with each day being about the same as the last. So finally we arrive at the relevance for today's daily featured chart. The chart presents the frequency of 24 hour change in temperature by week of the year. The highest frequencies can be found during July and August around values close to zero, hence the propensity for each day to be more like the last than not. Of course the major driver of that consistency is humidity, which helps to moderate temperatures during the day and night time. July and August look mostly the same in this chart and so the "Dog Days of Summer" term can equally apply to both months in the weather sense!
Voting: Good - 13 Bad - 2
Generate This Chart on Website
22 Jul 2022 05:30 AM
The "Dog Days of Summer" is an interesting term that folks tend to classify the summer weather as, but it actually applies to the juxtaposition of the Sun and Sirius. Anyway, the analog to weather typically relates to it being too hot for even a dog or things are hot and lazy as a dog with each day being about the same as the last. So finally we arrive at the relevance for today's daily featured chart. The chart presents the frequency of 24 hour change in temperature by week of the year. The highest frequencies can be found during July and August around values close to zero, hence the propensity for each day to be more like the last than not. Of course the major driver of that consistency is humidity, which helps to moderate temperatures during the day and night time. July and August look mostly the same in this chart and so the "Dog Days of Summer" term can equally apply to both months in the weather sense!
Voting: Good - 13 Bad - 2
Generate This Chart on Website
Mon Jul 25, 2022

Three Hour Flash Flood Guidance
25 Jul 2022 05:30 AM
The NWS creates a grid product called Flash Flood Guidance. This guidance estimates the amount of rainfall needed over a given time period to produce non-urban flash flooding. This product is often informative to look at as it sometimes reverse mimics recent heavy rainfall events. Such heavy rainfall events lower the threshold needed for near term future events as near surface soil is saturated and subsequent rainfalls will have higher amounts run-off, which leads to flash flooding. The heaviest rainfall totals over the weekend were confided to far northeastern Iowa and you can see the lower threshold amounts there.
Voting: Good - 12 Bad - 0
Generate This Chart on Website
Tue Jul 26, 2022
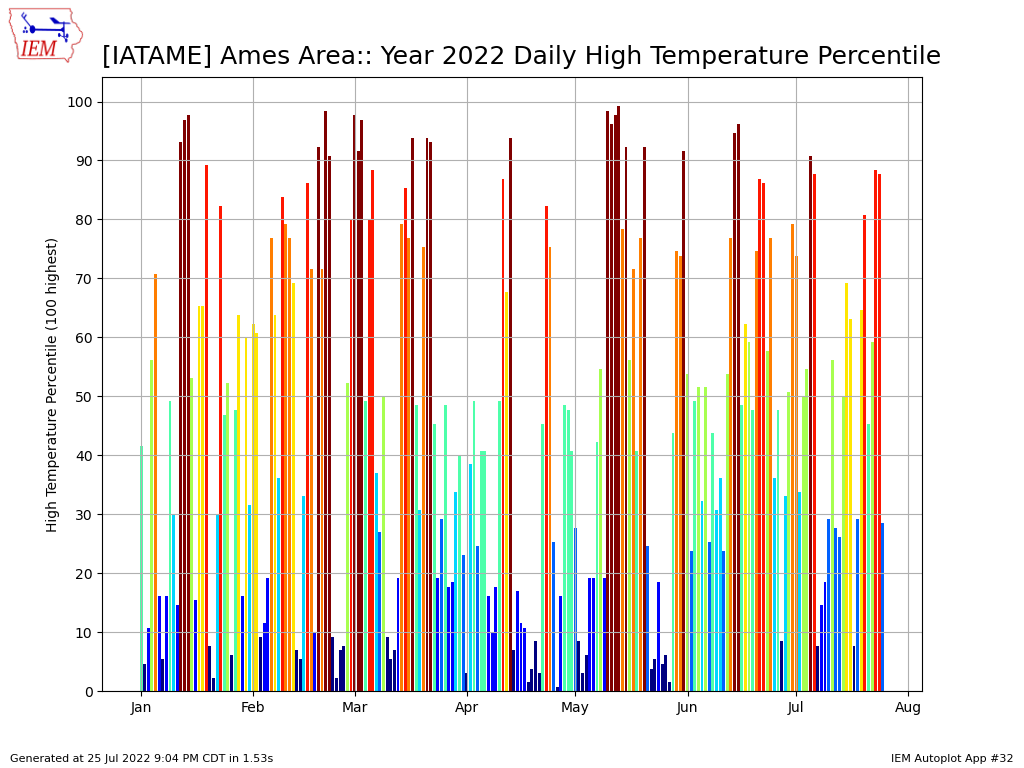
2022 High Temp Percentiles
26 Jul 2022 05:30 AM
Temperatures were amazing on Monday with highs in the 70s after the blistering hot Saturday with highs in the upper 90s. The difference between Friday and Monday is certainly noticeable when computing metrics like daily high temperature percentile as shown by the featured chart for Ames. There's a lot of variability shown in the chart as we have not had much for persistent hot nor cold so far this year. About the longest stretch of either was in late March and early April. The present near term forecast has pleasant temperatures for this week, but the first week of August is currently forecast to be very hot and again it is unclear how long that hot stretch will stick around.
Voting: Good - 10 Bad - 1
Generate This Chart on Website
Wed Jul 27, 2022

St Louis Deluge
27 Jul 2022 05:27 AM
An epic deluge of precipitation hit the St Louis metro area on Tuesday morning with the airport weather station reporting 8.64" of rainfall for the day, which was nearly two inches higher than the previous single day precipitation record (6.85") for the site. The featured chart presents the maximum hourly precipitation reports on record for the site based on unofficial IEM archives. A major caveat for a plot like this is that hourly precipitation data does not have as near a long period of record than the daily reports do. It is still quite remarkable to see two of the maximum hourly values occurring on consecutive hours yesterday morning.
Voting: Good - 14 Bad - 0
Generate This Chart on Website
Thu Jul 28, 2022
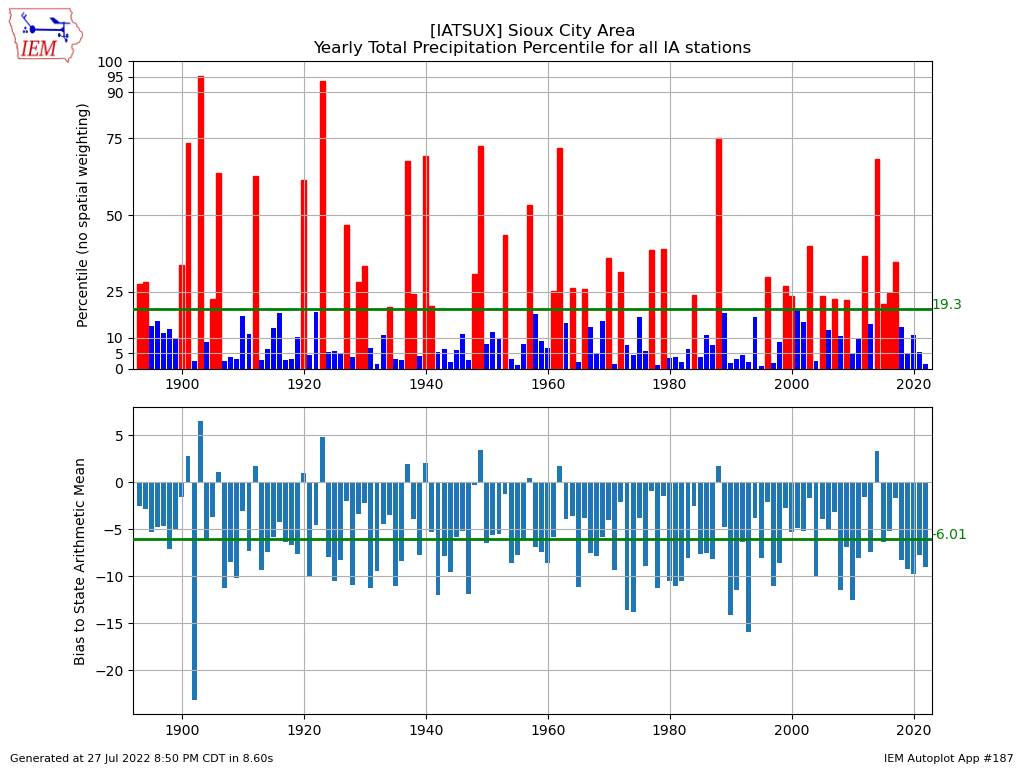
Sioux City vs Iowa
28 Jul 2022 05:30 AM
The Sioux City and surrounding area remains some of the driest in the state with very little to speak of for recent rainfalls. This area is also some of the climatologically driest in the state, so is this year just another typical year for the area? The featured chart attempts to look into that question by comparing the yearly precipitation total for Sioux City vs an unweighted population of other long term climate sites in the state. The top panel shows the percentile value that the Sioux City total ranks against all other Iowa reports and the bottom panel shows a bias against the simple statewide mean value. A note to start off with that this plot indicates that the values for 1902 may need some further review as it certainly looks suspect! That aside, this area is not always the driest part of the state and sometimes even wetter than a vast majority of other locations in the state. So the moral of the story is that dry portions of the state can still be anomalously dry as well!
Voting: Good - 10 Bad - 1
Generate This Chart on Website
Fri Jul 29, 2022

How Hot on Wednesday?
29 Jul 2022 05:26 AM
The pessimistic Iowan has had a difficult time enjoying the near perfect July weather this week knowing that "payback" will soon come. Sure enough, this pessimism was warranted as much of next week looks to be scorching hot with Wednesday currently forecast to be the hottest of them all! The featured map presents the latest NWS grid forecast for afternoon high temperature on 3 August. Much of the state is shown in the upper 90s with a good chuck over 100 and even pushing 104 around the Des Moines metro.
Voting: Good - 18 Bad - 2