IEM Daily Feature
Thursday, 04 August 2016
Thursday, 04 August 2016
June Dry, July Wet
Posted: 04 Aug 2016 05:39 AM
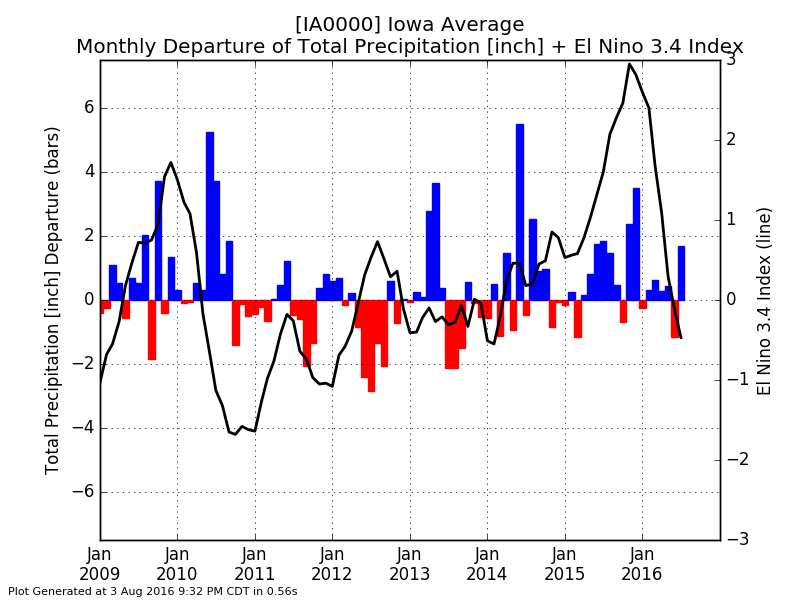
The featured chart displays the combination of monthly statewide precipitation departures
from long term average and El Nino 3.4 index. It remains to be seen if the most recent
'Godzilla El Nino' transitions into a full La Nina event, but this period has seen most months
above average for precip. You can generate this chart on the website for other locations in
the Midwest and for average temperature as well.
Voting:
Good = 9
Bad = 4
Voting:
Good = 9
Bad = 4