Information Last Ob Photographs Calibration Meteogram Network Table Neighbors Monthly Summaries Observation History Wind Roses Custom Wind Roses Data Calendar
| Mar 2024 | Apr 2024 | May 2024 | ||||
|---|---|---|---|---|---|---|
| Sunday | Monday | Tuesday | Wednesday | Thursday | Friday | Saturday |
| 31 | 01 High: 51.044 Low: 42.5858 Rain: 0.24 Gust: 18 (8:20 PM) RH% Min/Max: 93-100 Feel Min/Max: 36 to 51 | 02 High: 46.958 Low: 32.3888 Rain: 0.31 Gust: 29 (4:10 PM) RH% Min/Max: 74-100 Feel Min/Max: 22 to 42 | 03 High: 52.43 Low: 33.7496 Rain: 0.03 Gust: 40 (3:17 PM) RH% Min/Max: 42-96 Feel Min/Max: 22 to 52 | 04 High: 53.024 Low: 30.7454 Rain: 0.00 Gust: 27 (10:59 AM) RH% Min/Max: 47-86 Feel Min/Max: 24 to 53 | 05 High: 56.264 Low: 27.3092 Rain: 0.00 Gust: 14 (4:32 PM) RH% Min/Max: 43-96 Feel Min/Max: 22 to 56 | 06 High: 58.532 Low: 33.6092 Rain: 0.03 Gust: 32 (5:57 PM) RH% Min/Max: 45-89 Feel Min/Max: 26 to 59 |
| 07 High: 68.792 Low: 44.2562 Rain: 0.00 Gust: 32 (2:40 PM) RH% Min/Max: 30-90 Feel Min/Max: 36 to 69 | 08 High: 67.406 Low: 39.6392 Rain: 0.00 Gust: 21 (4:49 PM) RH% Min/Max: 37-91 Feel Min/Max: 35 to 67 | 09 High: 66.92 Low: 35.3966 Rain: 0.00 Gust: 18 (12:41 AM) RH% Min/Max: 33-92 Feel Min/Max: 32 to 67 | 10 High: 73.724 Low: 40.145 Rain: 0.00 Gust: 13 (2:14 PM) RH% Min/Max: 26-84 Feel Min/Max: 37 to 74 | 11 High: 58.55 Low: 44.9798 Rain: 0.00 Gust: 31 (4:24 PM) RH% Min/Max: 52-74 Feel Min/Max: 38 to 59 | 12 High: 66.794 Low: 39.758 Rain: 0.00 Gust: 27 (3:00 PM) RH% Min/Max: 24-80 Feel Min/Max: 33 to 67 | 13 High: 81.824 Low: 40.712 Rain: 0.00 Gust: 27 (2:41 PM) RH% Min/Max: 34-69 Feel Min/Max: 37 to 81 |
| 14 High: 88.466 Low: 57.614 Rain: 0.00 Gust: 22 (1:49 PM) RH% Min/Max: 22-72 Feel Min/Max: 58 to 85 | 15 High: 78.458 Low: 43.1078 Rain: 0.00 Gust: 23 (5:48 PM) RH% Min/Max: 26-69 Feel Min/Max: 40 to 78 | 16 High: 75.974 Low: 58.226 Rain: 0.21 Gust: 29 (4:49 PM) RH% Min/Max: 35-97 Feel Min/Max: 58 to 76 | 17 High: 68.216 Low: 50.63 Rain: 0.00 Gust: 29 (8:53 AM) RH% Min/Max: 44-95 Feel Min/Max: 51 to 68 | 18 High: 53.042 Low: 40.6274 Rain: 0.78 Gust: 22 (4:37 PM) RH% Min/Max: 66-100 Feel Min/Max: 36 to 53 | 19 High: 57.254 Low: 33.089 Rain: 0.00 Gust: 25 (3:28 PM) RH% Min/Max: 36-90 Feel Min/Max: 29 to 57 | 20 High: 41.063 Low: 35.1878 Rain: Gust: 12 (12:02 AM) RH% Min/Max: 54-69 Feel Min/Max: 30 to 36 |
| 21 High: M Low: M Rain: | 22 | 23 | 24 | 25 | 26 | 27 |
| 28 | 29 | 30 | 01 | 02 | 03 | 04 |
The data presented here provided by IEM API webservice: daily.json. A simple CSV option exists as well.
Daily High/Low Plot

Description: This chart of the monthly temperature data. The bars are the observations and the dots are climatology.
Daily Rainfall
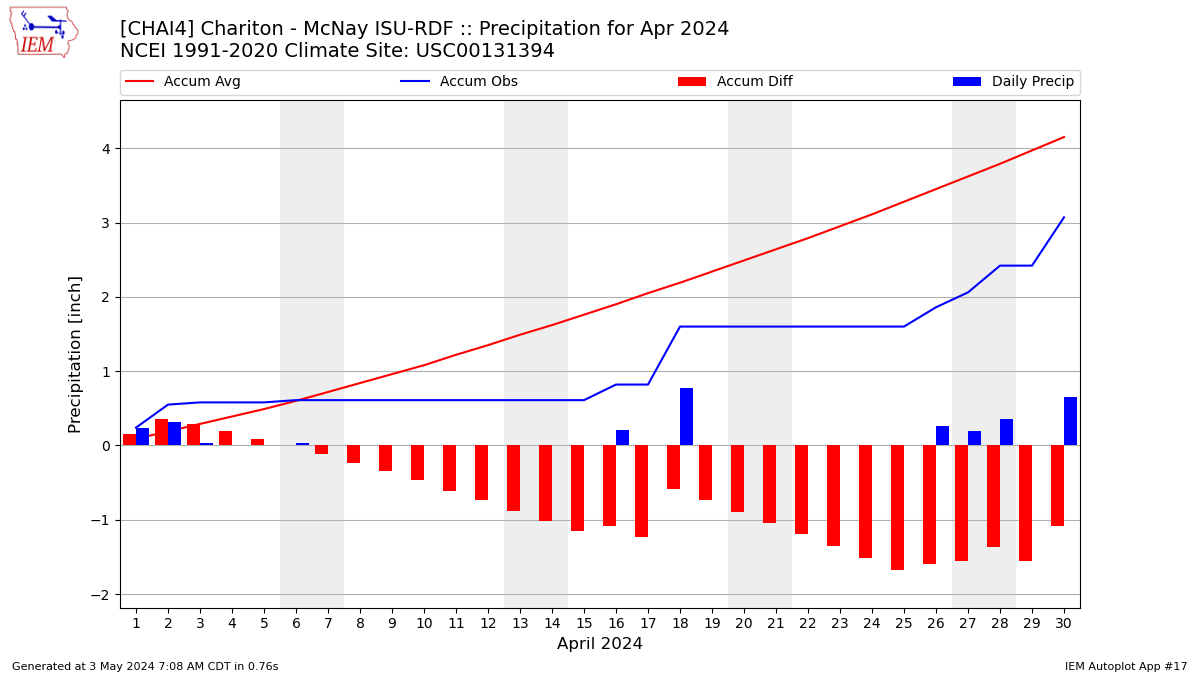
Description: This chart is of daily precipitation for the month. The red line would be an average month while the blue line and bars are observations.
Daily Average Wind Speeds

Description: This chart is of the daily average wind speeds.
The data presented here provided by IEM API webservice: daily.json. A simple CSV option exists as well.