Past Features
This page lists out the IEM Daily Features for a month at a time. Features have been posted on most days since February 2002. List all feature titles.
Mon Apr 01, 2019

March was cool and wet
01 Apr 2019 05:34 AM
The featured chart displays the combination of growing degree day departures along with precipitation departures for March expressed in terms of standard deviation (sigma) for Iowa statewide averaged data. This year was on the cool and wet side of average, but nothing too extreme for either metric. Since the growing degree days are always zero or small positive number in March, the lower bound for a departure is tight. On the other hand, the upper bound is large and you may recall the epic warmth of 2012 which noticeably sticks out on this plot.
Voting: Good - 9 Bad - 1
Tags: mar
Generate This Chart on Website
Tue Apr 02, 2019

Watching Soil Temps
02 Apr 2019 05:34 AM
Even with a light dusting of snow over northern Iowa overnight, hope continues to spring eternal that spring time is here and warmer temperatures. The warmer air temperatures and ever increasing solar inputs help to slow warm the soil temperatures up. The ISU Soil Moisture Network stations report hourly four inch depth soil temperatures and the featured map displays the max and min temperature for Monday. While temperatures are above freezing, we still have a ways to go to support most plants grown in the state. It is early April yet, so periods of cold air temperatures remain possible.
Voting: Good - 7 Bad - 0
Generate This Chart on Website
Wed Apr 03, 2019

'18-'19 Winter Storm #23
03 Apr 2019 05:32 AM
While not much of a storm, a quick moving system dumped an inch or two of snow over northern Iowa during the morning hours. This snow was gone by later in the day. This is typical for April snows as the sun can make quick work with a high incidence angle to the ground providing quick heating. Hopefully we can keep the April snow events to a minimum and avoid a repeat of 2018 whereby we had five storm events tracked by the IEM producing snow for the month.
Voting: Good - 14 Bad - 0
Tags: winter1819
Thu Apr 04, 2019

Recent beat of early January
04 Apr 2019 05:33 AM
The featured chart displays statistics on the year to date warmest high temperature for Ames. This year is compared with long term average along with the envelope of data. The warmth of early January set a somewhat high bar that was only recently beat by the warmer weather of late March as shown by the blue line. For the present value, we are only a few degrees below average meaning that our typical year to date warmest high temperature is not far from this year. The chart nicely shows that by the end of April, we should have seen our first 80 degree day, which would feel amazing! There is hope that maybe we can eek out a 70 degree high on Saturday.
Voting: Good - 11 Bad - 0
Generate This Chart on Website
Fri Apr 05, 2019

Ames representing Iowa
05 Apr 2019 05:34 AM
Ames is roughly located at the center of the state, so as a first approximation does its yearly precipitation total reside in the middle of the statewide distribution? The featured chart attempts to address that question with the caveat that no spatial weighting was done to the available observation dataset. Putting that aside, the top panel shows the percentile rank of Ames precipitation vs the statewide dataset by year. While the overall average is near 50%, the year to year variability is high. The bottom panel shows the yearly different to arithmetic mean of available data for the year. The overall bias is slightly negative, but close to zero. So in this case, being in the physical center of the state equates to the middle of the precipitation dataset over the long term.
Voting: Good - 10 Bad - 1
Generate This Chart on Website
Mon Apr 08, 2019

A Rare Warm Weekend
08 Apr 2019 05:33 AM
It was difficult for rain and even some thunderstorms on Sunday to put a damper on a very pleasant and warm weekend. The featured chart presents the daily high temperature departures from average for Ames this year. Having both weekend days well above average has not happened often so far this year with the most recent occurrence being back on the first weekend of February. After another warm day on Monday, focus turns to a powerful midweek storm which is expected to bring big time snow and blizzard conditions to somewhere in the Midwestern US.
Voting: Good - 11 Bad - 0
Generate This Chart on Website
Tue Apr 09, 2019

Little Early for 80
09 Apr 2019 05:35 AM
Temperatures on Monday rocketed well into the 70s and even 80s for some lucky locations in the state. Waterloo was one such location and the featured chart indicates it was a little bit early for such a warm temperature. The chart presents the combination of first date of the year at or above 80 degrees and the number of days that year meeting that criterion. This year's value comes in around the 25th percentile, so roughly one in four years have seen 80 degrees by 8 April for Waterloo. Sadly, it will be a bit before 80 degrees returns!
Voting: Good - 12 Bad - 2
Generate This Chart on Website
Wed Apr 10, 2019

Tight Snow Gradient
10 Apr 2019 05:35 AM
After an epic "bomb cyclone" storm hit the Midwestern US in March, another is set to take a similar storm track with similar intensity this week. The featured map presents NWS forecast snow totals for the event with a tight gradient of snow totals shown clipping northwestern Iowa. The winds will be extreme again for this event creating blizzard conditions. Another significant concern will be flooding as a lot of moisture is expected to fall.
Voting: Good - 15 Bad - 1
Thu Apr 11, 2019

Howling East Wind
11 Apr 2019 05:32 AM
With the extremely powerful storm system just off to our west, winds on Wednesday were howling out of the east rushing toward the low pressure system. A way to summarize the wind direction and speeds on Wednesday is through a wind rose chart. A wind rose is a histogram plotted on a polar plot. The length of the bars represent a frequency for a given speed and direction combination. The wind speeds are partitioned to break down the frequency by speed for a given direction. The plot nicely shows the dominate easterlies yesterday with hardly any winds reported less than 10 MPH.
Voting: Good - 16 Bad - 1
Generate This Chart on Website
Fri Apr 12, 2019

Increasing Wind Speed with Height
12 Apr 2019 05:33 AM
Winds were extremely strong on Thursday with sustained speeds in the 40-50 MPH range with gusts near 60 MPH. A number of semi-trucks were blown over during the morning hours coinciding with the strongest winds. The featured chart is of one minute averaged wind speeds from a research tower located north of Ames. This tower has wind instruments all the way up to near 400 feet above the ground surface. The chart shows the averaged wind speeds over one minute from one second samples, so these speeds would be sustained with higher gusts not shown. Wind speeds increase as you move away from the frictional effects of the ground surface. The chart nicely shows this as wind speed increases with each increase in height above the ground.
Voting: Good - 17 Bad - 1
Generate This Chart on Website
Sun Apr 14, 2019

'18-'19 Winter Storm #24
14 Apr 2019 08:57 PM
The second "Bomb Cyclone" of the spring season packed a serious punch last week. While Iowa mostly missed out on the heavy snowfall totals, the state was significantly impacted by strong easterly winds. The featured map shows the highest totals were very isolated to the extreme northern corners of the state. Snowfall totals greatly increased just to our north with isolated locations near two feet of snow. Some snowfall clipped southeastern Iowa on Sunday with the highest totals off into Illinois. Are we ever going to be done with winter?
Voting: Good - 10 Bad - 0
Tags: winter1819
Tue Apr 16, 2019
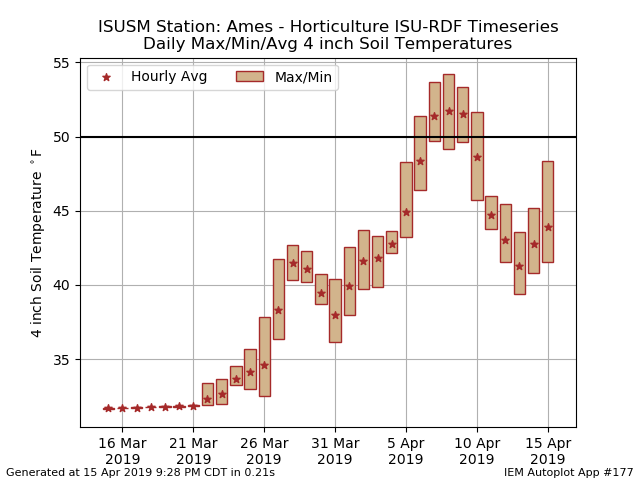
Daily Four Inch Soil Range
16 Apr 2019 05:34 AM
Soil temperatures are closely watched this time of year to help with agricultural and gardening activities. The featured chart presents the daily range in four inch depth soil temperature from the ISU Horticulture Farm just north of Ames. The chart shows the daily range (bar) and average value (starred). The chart begins with a frozen soil condition and shows the nice warm-up that happened two weeks ago. This warm up was proceeded by cooler weather and so temperatures dropped back down. The pattern shown on this chart is typical of April in Iowa. Periods whereby the top soil is warm enough for planting most crops is limited during early April and often any warm periods are followed by colder periods.
Voting: Good - 11 Bad - 1
Tags: soil
Generate This Chart on Website
Wed Apr 17, 2019

Second Slight Risk for Iowa
17 Apr 2019 05:36 AM
Thunderstorms and severe convective weather have not been that common so far this year for Iowa. Of course, it is early in the season. The featured calendar displays the highest Storm Prediction Center convective risk over some portion of the state so far this year. Today we are under a slight risk and that makes for the second so far this year. The one last week barely scraped western Iowa, so this is the first threat for the state so far.
Voting: Good - 9 Bad - 0
Tags: spc
Generate This Chart on Website
Thu Apr 18, 2019

Few Warm Days
18 Apr 2019 05:34 AM
Air temperatures warmed nicely on Wednesday ahead of the passage of a cold front and associated thunderstorms. For Ames, the number of warm days has been limited. The featured chart depicts the number of days so far this year that the high temperature has been at or above a given level. The record most number of days is plotted as well along with the year associated with the record.
Voting: Good - 9 Bad - 1
Generate This Chart on Website
Fri Apr 19, 2019

Reaching 75+ in April
19 Apr 2019 05:32 AM
Low temperatures on Saturday are forecast to start off chilly in the 30s, but then recover into the mid 70s. Is this common for April? The featured chart attempts to address that by looking at hourly temperature distributions on days with a high temperature of at least 75 degrees for Ames. The distributions are shown by box and whisker plots showing the inter-quartile range box and whiskers out two sigma. For these days, the overnight temperatures are typically in the upper 40s or lower 50s. The forecast situation on Saturday is not too rare though as plenty of events are indicated by the chart.
Voting: Good - 8 Bad - 0
Generate This Chart on Website
Mon Apr 22, 2019

April Temps + Dew Points
22 Apr 2019 05:34 AM
Temperatures on Easter Sunday soared into the 80s for much of Iowa. Dew point temperatures remained comfortable around 50 degrees of less. That combination is typical for this time of year which makes the 80 degree temperatures feel so amazing (low humidity). The featured chart shows the combination of average dew point by air temperature during April for Des Moines. Yesterday's weather was above average as shown by the chart. Of course, such combinations during summer months in Iowa are very rare as elevated humidity comes to visit for the summer and generally refuses to leave.
Voting: Good - 8 Bad - 0
Generate This Chart on Website
Tue Apr 23, 2019

Done with snowfall?
23 Apr 2019 05:37 AM
The featured chart displays the date, amount, and the duration that the last snowfall of the season stuck around for Des Moines. The calendar now says 23 April, which comes in at about 92% on the chart. So about 8% of all previous years had another measurable snowfall on this date or later. The forecast continues to be optimistic that we are done with the snow this season, but it would certainly help to have another week pass by to be more confident.
Voting: Good - 9 Bad - 3
Generate This Chart on Website
Wed Apr 24, 2019

Amazing to Talk Dryness
24 Apr 2019 05:33 AM
After a wet and snowy winter, it is somewhat amazing to now be discussing some dryness that has developed over Iowa. The featured map is of precipitation departures from average over the 11 March thru 22 April period. A significant portion of central and southeastern Iowa is below 75% of average with a smaller portion below 50%. Not many folks are currently complaining though as this dry weather was just what was needed to dry out the agricultural fields. There is also significant soil moisture still present and high river flows yet from the snow melt, so this dry weather has had few negative impacts.
Voting: Good - 13 Bad - 3
Generate This Chart on Website
Thu Apr 25, 2019

Large Gap
25 Apr 2019 05:34 AM
Yesterday's IEM Daily Feature denoted the dryness that has accumulated over the past month of so for much of Iowa. The impacts of this dryness though were nearly all positive after an extremely wet 2018 and winter season. Today's featured chart attempts to illustrate his dichotomy by plotting the trailing 31, 91, and 365 day precipitation departures for Ames. The current values show a large gap between the short term and long term departure. While the 365 day departure is about 17 inches above average, the near term values are closer to zero or slightly negative. The near term forecast has chances of rain, so perhaps the near term dryness is about to be erased.
Voting: Good - 9 Bad - 0
Generate This Chart on Website
Fri Apr 26, 2019

Adding Water to Air
26 Apr 2019 05:31 AM
One of the aspects that makes this time of year nice in Iowa is the general lack of significant humidity. This lack of humidity is helped by having a landscape around us that is generally void of transpiring crops this time of year. The featured chart illustrates this by comparing the daily specific humidity change between 6 AM to 6 PM for Ames. Transpiring crops and other vegetation add moisture to the air during the daytime and thus increasing the humidity. The featured chart nicely shows the primary season for this addition of water to the atmosphere between early June and rapidly dropping off during September.
Voting: Good - 10 Bad - 0
Generate This Chart on Website
Sat Apr 27, 2019

Chance of 8+ Inches
27 Apr 2019 06:42 AM
The featured map is of forecast probability that at least eight inches of snow falls over the next 72 hours from the Weather Prediction Center. This is an amazing map considering that the calendar says April 27th! Big snowfalls this time of year fall as the concrete kind with major threats to damaging trees and making impossible travel conditions. To accumulate this much snow, it needs to fall quickly to mitigate the impacts of warm soil temperatures and any filtered sunshine working to melt it.
Voting: Good - 12 Bad - 0
Tags: wpc
Sun Apr 28, 2019

'18-'19 Winter Storm #25
28 Apr 2019 08:26 PM
While the high end snowfall totals did not pan out for Iowa, the weekend storm system brought more snow than probably anybody wanted at this point in the spring season. At least the snow was able to push the seasonal total for places like Waterloo and Rochester, MN to record levels. Besides the snow, very cold air settled into the state on Sunday with below freezing temperatures for a good portion of the state. This snow had no chance of sticking around long as highs on Sunday were already back into the 40s over this area.
Voting: Good - 14 Bad - 0
Tags: winter1819
Tue Apr 30, 2019

April Clouds + Visibility
30 Apr 2019 05:34 AM
The featured chart displays the combination of hourly cloud height and coverage along with surface visibility for Ames during this April. The month has seen stretches of clouds and of clear skies. The bottom panel shows the horizontal near-surface visibility and shows only a few periods of low visibility. Clouds will be common again to close out the month along with rain.
Voting: Good - 9 Bad - 0
Generate This Chart on Website