Past Features
This page lists out the IEM Daily Features for a month at a time. Features have been posted on most days since February 2002. List all feature titles.
Sun Jul 01, 2018

Des Moines Metro Flash Flooding
01 Jul 2018 01:41 PM
A historic Flash Flood event hit the Des Moines Metro hard on Saturday night with between three to ten inches of rain falling over just a few hours on the evening of 30 June 2018. The featured plot is of NOAA MRMS rainfall estimates from the event and are actually underestimating the totals some given the overlain reports from the NWS. The initial Flash Flooding has given way to more long term flooding with impacts to be felt for days to come.
Voting: Good - 14 Bad - 2
Tags: 2018 flashflooding
Tue Jul 03, 2018

Increasing Two Inch Rainfalls
03 Jul 2018 06:32 AM
The recent numerous rounds of heavy rainfall events to hit the state are a good reminder of one of the stronger climate change signals present in the state. That change being an increase in the number of heavy rainfall events. The featured chart looks at the decade average number of days each year an Iowa station received at least two inches of rain. This average is based on long term climate sites tracked by the IEM. While the differences plotted seem small, a change from one day per year to 1.5 days per year is a 50% increase of the rate. Such events place stress on water infrastructure and increased urbanization amplifies their impacts.
Voting: Good - 17 Bad - 3
Tags: climatechange
Wed Jul 04, 2018

Hot Fourth of July
04 Jul 2018 05:55 AM
High temperatures for the Fourth of July are expected in the lower 90s for most of Iowa, which is plenty warm for the date as shown by the featured chart of high temperatures on this date for Des Moines. The humidity will also be high creating heat index values over 100 degrees. A Heat Advisory is in effect for most of the state for today.
Voting: Good - 6 Bad - 0
Generate This Chart on Website
Thu Jul 05, 2018

Hours of 90+
05 Jul 2018 05:42 AM
Hot and muggy conditions were present in Iowa on Wednesday for the fourth with temperatures at or above 90 degrees for much of the state. The featured map presents the number of hours this year that the temperature was that warm based on a gridded analysis product from the NWS. If you want to beat the heat, this map shows a number of places to consider going. In general, those areas include any where elevated or over water. It is not much wonder why those locations are favored vacation spots for summer. Our forecast keeps temperatures in the 80s for a few days for most of the state, before a return of some 90s next week.
Voting: Good - 9 Bad - 0
Fri Jul 06, 2018
Plenty of Humidity
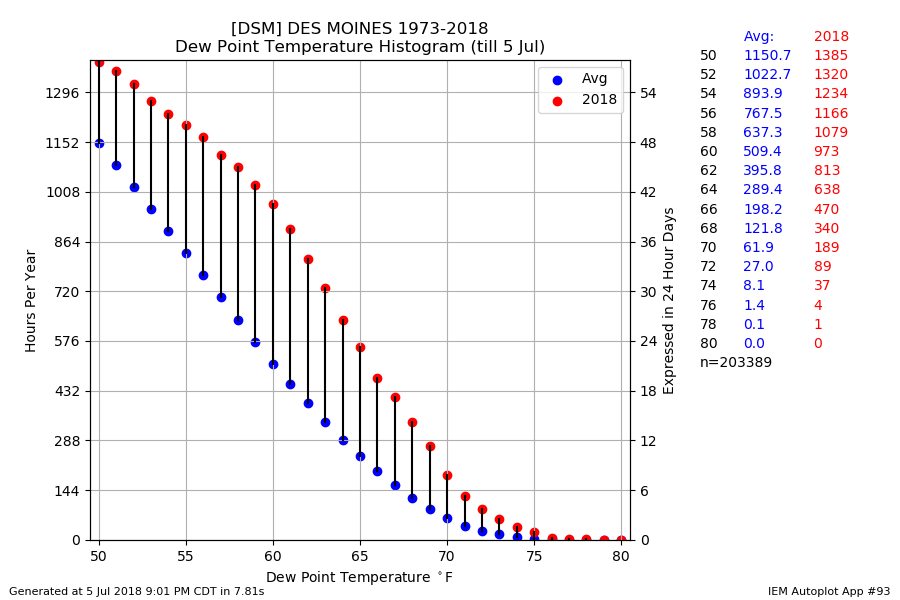
06 Jul 2018 05:40 AM
Much drier air is expected for this weekend, which is a welcome break from the increased humidity levels we have seen for much of 2018. The featured chart presents the number of hours this year and on average that the dew point temperature was at a given level for Des Moines. The 2018 totals are well above average. The increased humidity has certainly helped fuel heavy precipitation events so far this summer. It has also helped buoy overnight low temperatures, which have been exceptionally warm this summer. Thankfully, the break from the elevated humidity this weekend will also help over night low temperatures drop safely into the 'open your windows' range.
Voting: Good - 13 Bad - 1
Tags: 2018 dewpoint
Generate This Chart on Website
Mon Jul 09, 2018

July Pressure Records
09 Jul 2018 05:38 AM
Iowa's weather this past weekend was spectacular with plenty of sunshine and light winds along with reasonable humidity and temperature levels. This weather was thanks to an expansive high pressure system the covered much of the continental US. This system was rather remarkable for its size and strength. A number of July maximum pressure observations were recorded over the Midwestern US. The featured chart shows the hourly pressure maximums for the Mason City Airport weather station based on IEM archives. Friday's values were records for most hours and eclipsed the previous high maximum set back in 1997.
Voting: Good - 8 Bad - 1
Tags: jul18
Generate This Chart on Website
Tue Jul 10, 2018

GFS MOS
10 Jul 2018 05:33 AM
The title of today's IEM Feature is an acronym representing the Global Forecast System (GFS) Model Output Statistics (MOS). MOS attempts to adjust physical model output by applying known biases of the model to predict a local weather station's observations. The featured chart displays the combination of a time lagged ensemble of MOS forecasts along with the actual observations for the Des Moines Airport. The bars represent the range in values present with the MOS forecasts. The GFS MOS has been running a bit warm this month with its predictions of high temperature. No forecasting system is perfect, it is one of the many tools forecasters use to make a forecast.
Voting: Good - 12 Bad - 1
Generate This Chart on Website
Wed Jul 11, 2018

Early Corn Silking
11 Jul 2018 05:36 AM
The most recent update from the USDA NASS Crop Statistics show a rapidly maturing corn crop over much of the midwestern US. The map displays the statewide estimates of percentage of the corn crop in silking stage with the bottom labelled number and colors representing the departure from the previous ten year average. This is an important time of year for the development of corn as hot and humid conditions tend to be a negative for yield potential. Some of these areas are also in drought, which is a negative as well.
Voting: Good - 9 Bad - 0
Tags: nass
Generate This Chart on Website
Thu Jul 12, 2018

Heat Headlines
12 Jul 2018 05:32 AM
The heat and humidity weather knobs are again turned well to the right with heat index values expected above 100 degrees for much of the state today. Accordingly, the NWS has a Heat Advisory covering most of the state. The featured chart presents the frequency of the NWS having a heat related headline active for Story County (where the Ames Airport weather station resides). This frequency is based on hourly reports and the major caveat is that having a very hot instantaneous index does not necessarily warrant a headline issuance by the NWS. These headlines typically require a consecutive stretch of hours with high heat indices along with little overnight relief. Heat impacts tend to be cumulative as prolonged exposure to heat decreases resilience.
Voting: Good - 8 Bad - 0
Tags: heatindex
Generate This Chart on Website
Fri Jul 13, 2018

Some 110s
13 Jul 2018 05:34 AM
Air temperatures in the 90s and dew points well into the 70s created for dangerous heat index values on Thursday. The featured map displays a grid analysis of maximum heat index values based on hourly NWS NCEP data from the realtime mesoanalysis. This product indicates a few places in Iowa reached 110+ degrees on Thursday and nearly all of the state over 100 degrees. The current near term forecast has a respite from the extreme heat and more frequent chances of rain.
Voting: Good - 17 Bad - 5
Mon Jul 16, 2018

Fewest Watches since 1997
16 Jul 2018 05:42 AM
Not that anybody is complaining other than storm chasers, but this year continues to be a very slow year for severe weather over the United States. The featured chart displays the combined number of Severe Thunderstorm and Tornado watches issued by the Storm Prediction Center since 1997. The second plot shows the number that likely had some coverage over Iowa and the third plot represents the percentage of these watches against the nationwide total. The totals this year, for the year to date period, are the smallest since 1997.
Voting: Good - 9 Bad - 2
Generate This Chart on Website
Tue Jul 17, 2018

Humidity Switch Turned On
17 Jul 2018 05:35 AM
The featured chart displays daily averaged surface mixing ratio for Ames. This value is an absolute measure of humidity that is more linear in nature than dew point and is not directly temperature dependent like relative humidity. The top panel shows this year's values along with the range of values from previous years. The bottom panel shows the daily departures from period of record averages. The departures for this year show a remarkable switch near 1 May from dry to humid conditions. It is almost like a switch was thrown and the elevated humidity has dominated since. Thankfully, a respite has arrived for Tuesday with comfortable dew point temperatures.
Voting: Good - 8 Bad - 0
Tags: 2018
Generate This Chart on Website
Wed Jul 18, 2018

High 500hPa Heights
18 Jul 2018 05:35 AM
The featured chart depicts May, June, and July yearly averaged 500 hPa level heights from the Omaha area sounding site. This year's value, so far, is the highest on record and an indicator of the warm conditions that have prevailed during this period. Soundings are the twice daily released balloons that profile the temperature, pressure, humidity and wind condition of the atmosphere. The high height of the 500 hPa surface is an indication of warmth of the air between the ground surface and that height.
Voting: Good - 7 Bad - 0
Tags: sounding
Generate This Chart on Website
Thu Jul 19, 2018

Departures since May 1
19 Jul 2018 05:35 AM
The featured map presents the combination of last week's US Drought Monitor and percent of average accumulations since 1 May based on Oregon State PRISM estimates. The driest areas of the state remain in far southeastern Iowa, but other portions of the state show up dry with this analysis as well. The US Drought Monitor considers precipitation departures over different short and longer term periods along with actual hydrological impacts, so you won't see an exact overlap between the depiction and a departure map like this one. There are chances of rain in the forecast and the dry areas certainly need the rain. With another week of dry weather, this area will likely see some degradation with the drought monitor analysis.
Voting: Good - 11 Bad - 0
Generate This Chart on Website
Fri Jul 20, 2018

July 19th Tornado Outbreak
20 Jul 2018 05:34 AM
When one thinks of tornado season in Iowa, the month of July is not the first thing that comes to mind. The Tornado Outbreak of July 19th will be remembered for quite some time around Iowa. The event started with many photogenic funnel clouds and small tornadoes. Some of these tornadoes did damage in places like Altoona and Bondurant (northeastern suburbs of Des Moines). Larger and more destructive tornadoes followed later in the day with the cities of Pella and Marshalltown taking direct hits. The Pella tornado passed by the KCCI-TV webcam, but the viewing was difficult with the featured image being one of the better views it got. A YouTube timelapse from the webcam is available for your viewing.
Voting: Good - 18 Bad - 2
Tags: webcam tornado
Generate This Chart on Website
Mon Jul 23, 2018

July Sub 60 Dew Points
23 Jul 2018 05:40 AM
Very pleasant air was to be found over Iowa this past weekend with some locations lucky enough to dip below 60 degree dew point temperatures. Such values are not that uncommon during July, but have been difficult to come by this year. The featured chart presents some frequency stats on such sub 60 degree dew points. The top chart shows the total number of hours each July for Des Moines and the bottom chart looks at the number of days each July that they hourly dew point was sub 60. The year 2011 only has 1 hour, so this year's meager total could certainly be worse. The forecast this week continues the very pleasant mid-summer conditions, which are near ideal for RAGBRAI.
Voting: Good - 9 Bad - 0
Generate This Chart on Website
Tue Jul 24, 2018

Small Uptick in Dew Point
24 Jul 2018 05:34 AM
The very pleasant mid summer weather continued in Iowa on Monday, but while high temperatures were again in the lower 80s, there was a small and discernible uptick in dew point temperature. The featured chart displays a meteogram from the Ames Airport showing various weather observations over the past three days. Of note here is the green line within the top panel showing the small increase in dew point yesterday from the lower 60s to mid 60s. Some drier air is attempting to work into the state, but peak transpiration crops will work to moisten the lower layer of the atmosphere back up.
Voting: Good - 9 Bad - 0
Generate This Chart on Website
Wed Jul 25, 2018

Mayflies in July
25 Jul 2018 05:35 AM
It is that time of year for the Mayflies along the Mississippi River. The featured RADAR animation is from the La Crosse, Wisconsin site Tuesday evening between 8 and 10 PM. You can see the reflectivity returns light up along the river. The further south you travel away from the RADAR the higher the beam is, so it is likely missing the activity. The tracking of Mayflies via RADAR is well documented and NWS La Crosse even has a webpage dedicated to the topic.
Voting: Good - 11 Bad - 0
Tags: mayflies
Thu Jul 26, 2018

D3 Expansion
26 Jul 2018 08:06 AM
The newly released US Drought Monitor depicts a worsening drought situation of parts of southern Iowa. The "D3" classification was spatially expanded slightly this week. The featured map is from the US Drought Monitor website and also presents some statistics regarding spatial coverage over Iowa. The current forecast for the next week is not very optimistic for significant rainfall over this area or other areas in the state.
Voting: Good - 4 Bad - 0
Fri Jul 27, 2018

Sub 50 then Sub 40
27 Jul 2018 05:38 AM
Some of the coolest temperatures of the second half of the calendar year are present over Iowa this morning. The coolest low temperature for Ames has yet to breach 50 degrees. The featured chart displays the combination of the date of the first fall season sub-50 degree low temperature and the subsequent number of days until the first sub-40 degree temperature happened. That outlier blip shown near July 8 happened back in 1895. The dashed lines on the chart allow the forward translation of the dots to an actual date. So having the first sub-50 is not uncommon for any time during the late summer season. It certainly takes longer until the first sub-40 is common for Ames.
Voting: Good - 10 Bad - 1
Generate This Chart on Website
Mon Jul 30, 2018

Respite from the Heat
30 Jul 2018 05:34 AM
The really muggy and hot conditions vacated the state just in time for RAGBRAI last week and made for a number of very comfortable late July days in the state. The featured chart displays the daily range between the max and min feels like temperature for 2018 for Ames. Any date with this range at least containing 80 degrees is highlighted in red. The last few days have been very nice with the heat index only barely reaching 80 on Sunday. The heat is slowly expected to build back into the state this week, but over night lows are expected to remain comfortable.
Voting: Good - 8 Bad - 0
Tags: feelslike
Generate This Chart on Website
Tue Jul 31, 2018

Streaks below 80 in July
31 Jul 2018 05:35 AM
The Estherville Airport weather sensor has reported a temperature below 80 degrees since 6 PM on the 25th of July. So as of this morning, the streak below 80 during the month of July stands at just over five days. The featured chart looks at the longest such streaks at the site and shows the six such stretches. So the current streak is nothing too exceptional for the site and the current forecast would indicate 80+ should happen today.
Voting: Good - 7 Bad - 0
Generate This Chart on Website